
Figure 5.
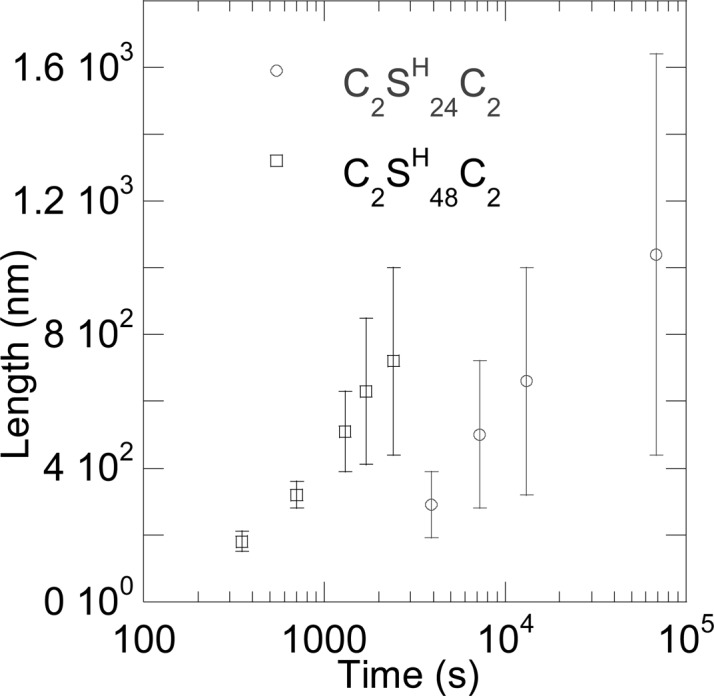
Average fiber length (n = 50–90) as a function of the time after shift from pH 2 to pH 8 (50 mM phosphate buffer) for 1 g/L solutions of C2SH24C2 and C2SH48C2, as measured by AFM. Error bars represent standard deviations.
Official websites use .gov
A
.gov website belongs to an official
government organization in the United States.
Secure .gov websites use HTTPS
A lock (
) or https:// means you've safely
connected to the .gov website. Share sensitive
information only on official, secure websites.
Average fiber length (n = 50–90) as a function of the time after shift from pH 2 to pH 8 (50 mM phosphate buffer) for 1 g/L solutions of C2SH24C2 and C2SH48C2, as measured by AFM. Error bars represent standard deviations.