
Fig. 2.
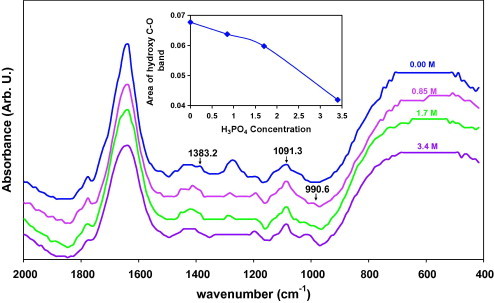
FTIR spectra for films of (PVA)0.7(NaBr)0.3(H3PO4)xM where x = 0.00, 0.85, 1.7, 3.4 M. The inset represents composition dependence of the relative area under the hydroxy C—O band.
Official websites use .gov
A
.gov website belongs to an official
government organization in the United States.
Secure .gov websites use HTTPS
A lock (
) or https:// means you've safely
connected to the .gov website. Share sensitive
information only on official, secure websites.
FTIR spectra for films of (PVA)0.7(NaBr)0.3(H3PO4)xM where x = 0.00, 0.85, 1.7, 3.4 M. The inset represents composition dependence of the relative area under the hydroxy C—O band.