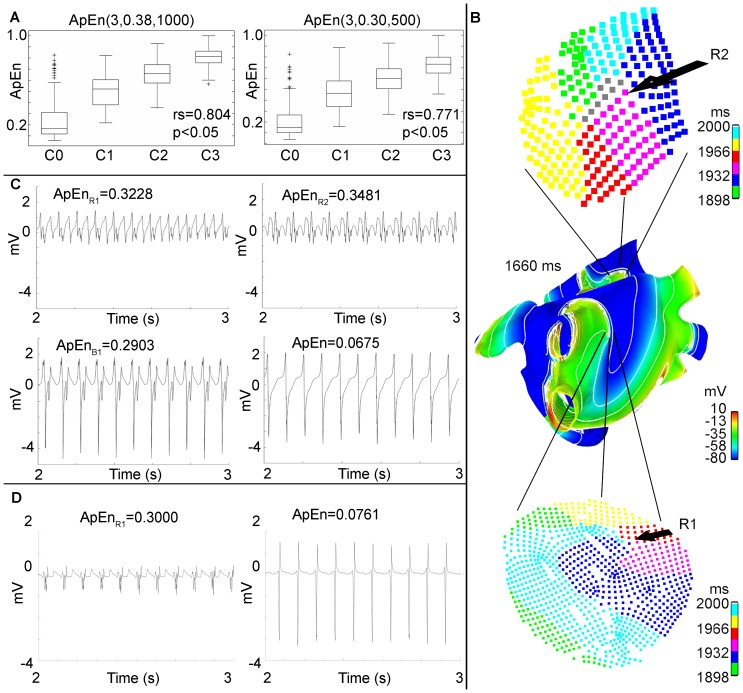
Figure 3. Localization of stable rotors.
A: Results of the optimization procedure. Boxplots of ApEn normalized values using optimized parameters:  (left) and
  (right). The Spearman correlation coefficient calculated over DB-CZ-GE for each boxplot is shown. B: Activation isochronic maps corresponding to R1 (below) and R2 (top). The rotor tip is indicated where the colors converge. C: EGM generated by the model in the areas of stable rotors and the block for the time interval between 2 s and 3 s. EGM corresponding to the R1, R2, B1 and plane activation wavefront areas. D: Bipolar EGM corresponding to R1 and plane activation wavefront area. ApEn values for each EGM are shown.

