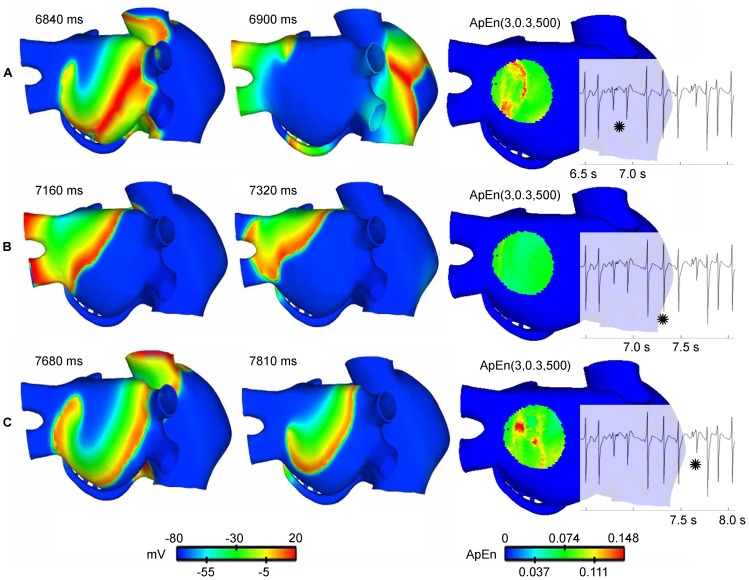
Figure 4. Meandering rotor tracking.
The left and centre snapshots in A, B and C show the evolution of the action potential at three time instants. Meandering rotational activity is present in A and C. The snapshot on the right corresponds to the dynamic ApEn(3,0.30,500) maps. High ApEn values (red color) correspond to the presence of a meandering rotor. EGM is also shown. The star marks the 500-point interval corresponding to the evolution of the action potential. Fragmentation is generated in the presence of a rotor (A and C).

