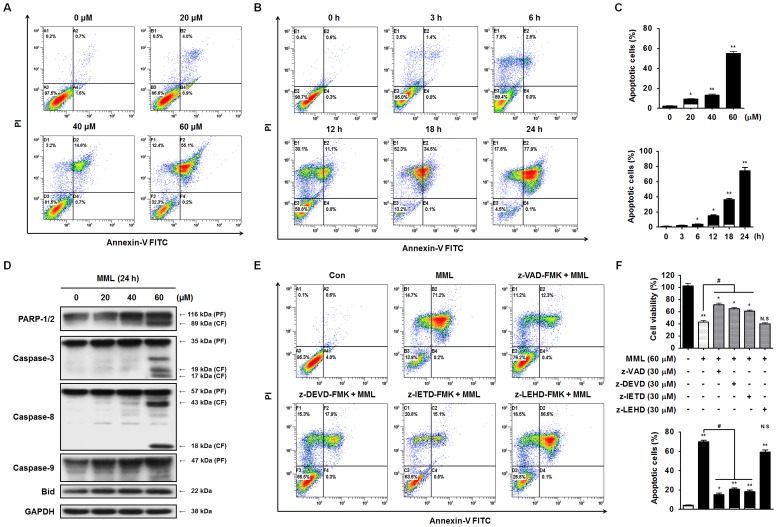
Figure 2. MML induces caspase-mediated apoptosis in A549 cells.
(A) A549 cells were treated with the MML as indicated concentrations (0–60 µM) for 24 h and then stained with FITC- conjugated Annexin V and PI. Apoptotic cells were measured by flow cytometer. (B) A549 cells were treated with 60 µM of MML for a time dependent manner. Apoptotic cells were then stained with Annexin V and PI and detected using flow cytometer. (C) Bar graph indicates the percentage of apoptotic cells (dose-dependent manner; top, time-dependent manner; bottom). Apoptotic population was evaluated by Annexin V positive, PI negative (AV+/PI-, white bar) and Annexin V and PI double positive (AV+/PI+, black bar) apoptotic cells. (D) Cells were treated with the MML as indicated concentrations (0–60 µM) for 24 h and Western blot analysis was performed to check apoptosis marker, caspase−3, −8, −9, Bid and PARP-1/2, respectively. GAPDH was used as loading control of Western blot analysis. (E) Cells were pretreated with or without each caspase inhibitor, Z-VAD-FMK (30 µM), Z-DEVD-FMK (30 µM), Z-IETD-FMK (30 µM) and Z-LEHD-FMK (30 µM) for 1 h and then treated with MML (60 µM) for 24 h. Apoptotic cells were stained with Annexin V and PI and then populations were detected by flow cytometer. (F) Cells were treated with caspase inhibitors and MML under the same conditions as the flow cytometric analysis and then cell viability was measured by MTT assay. Bar graphs indicate the percentage of cell viability (top) and the percentage of apoptotic cells (bottom), respectively. Apoptotic population was evaluated by Annexin V positive, PI negative (AV+/PI-, white bar) and Annexin V and PI double positive (AV+/PI+, black bar) apoptotic cells. All data were expressed as mean ± SEM of three independent experiments. *p<0.05 and **p<0.01 compared with control; # p<0.05 compared with MML-treated group.

