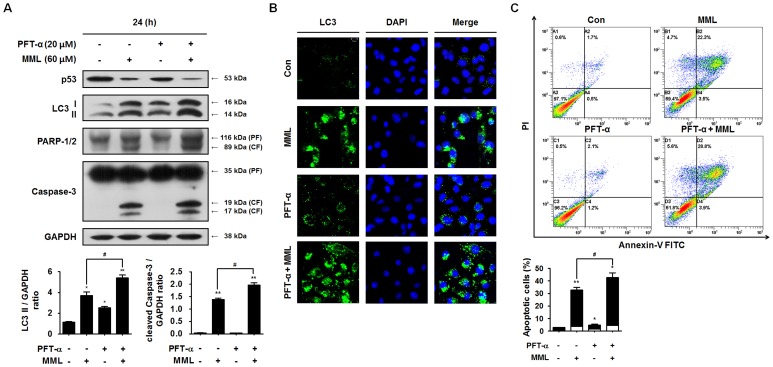
Figure 6. MML-induced autophagy is associated with the decrease in p53 levels.
(A) A549 cells were co-treated with or without pifithrin-α (PFT-α, 20 µM) and MML (60 µM) for 24 h. After that, immunoblot analysis was performed with antibodies against p53, LC3, PARP-1/2 and caspase-3, respectively. Bar graphs indicate the ratio of LC3-II/GAPDH and the cleaved caspase-3/GAPDH, respectively. (B) A549 cells were co-treated with or without PFT-α (20 µM) and MML (60 µM) for 24 h and then immunofluorescence staining was performed using LC3 (green) antibody. Nuclei were stained with DAPI (blue). Fluorescent images were obtained using confocal microscope (Bar; 10 µm). (C) Cells were co-treated with or without PFT-α (20 µM) and MML (60 µM) for 24 h and apoptotic cells were stained with FITC-conjugated Annexin V/PI and analyzed by flow cytometry. Bar graph indicates the percentage of apoptotic cells. Percentage of apoptotic cells was evaluated by Annexin V positive and PI negative (AV+/PI-, white) and Annexin V and PI double positive (AV+/PI+, black) apoptotic cells. All data were expressed as mean ± SEM of three independent experiments. *p<0.05 and **p<0.01 compared with control; # p<0.05 compared with MML-treated group.

