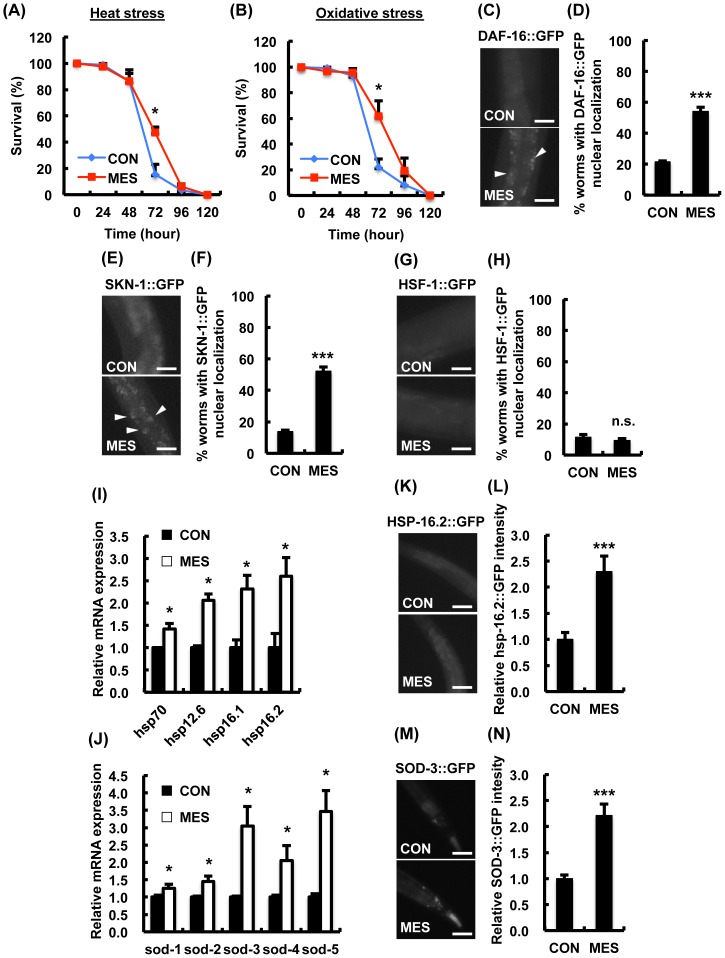
Figure 1. MES increases stress resistance in wild type N2 worms.
(A, B) N2 worms were treated once a day with MES (0.1 ms. 2 V/cm, 55 pps) for 20 min at larval stage. After the last treatment, worms were incubated under (A) heat stress (30°C) or (B) oxidative stress (4 mM paraquat) condition. Worms' survival was checked every 24 hr. Each time point is the average of three independent experiments using 80–100 animals per group for each experiment. Data are presented as mean ± SE. *P<0.05, assessed by unpaired Student t-test. (C-H) Worms expressing GFP reporter were treated once a day with MES for 20 min at larval stage. After the last treatment, images of GFP (DAF-16::GFP, SKN-1::GFP and HSF-1::GFP) were obtained using a fluorescent microscope. Percentage of worms with GFP nuclear localization (white arrowhead) was quantified. Data are presented as mean ± SE. ***P<0.001 versus control, assessed by unpaired t-test. Scale bars, 25 µm. (I, J) Wild type N2 worms were treated once a day with MES for 20 min at larval stage. After the last treatment, total RNA was extracted and subjected to quantitative real-time PCR. Data are representative of two independent experiments using approximately 200 animals per group. Data are presented as mean ± SE. *P<0.05, assessed by unpaired Student t-test. (K-N) Worms expressing GFP reporter were treated once a day with MES for 20 min at larval stage. After the last treatment, images of GFP (HSP-16.2, SOD-3::GFP) were obtained using a fluorescent microscope. Relative fluorescent intensity of GFP was quantified. Data are presented as mean ± SE. ***P<0.001, assessed by unpaired Student t-test. Scale bars, 25 µm. For GFP fluorescence experiments (C–H and K–N), data shown are representative of two independent experiments using 40–50 animals per group.

