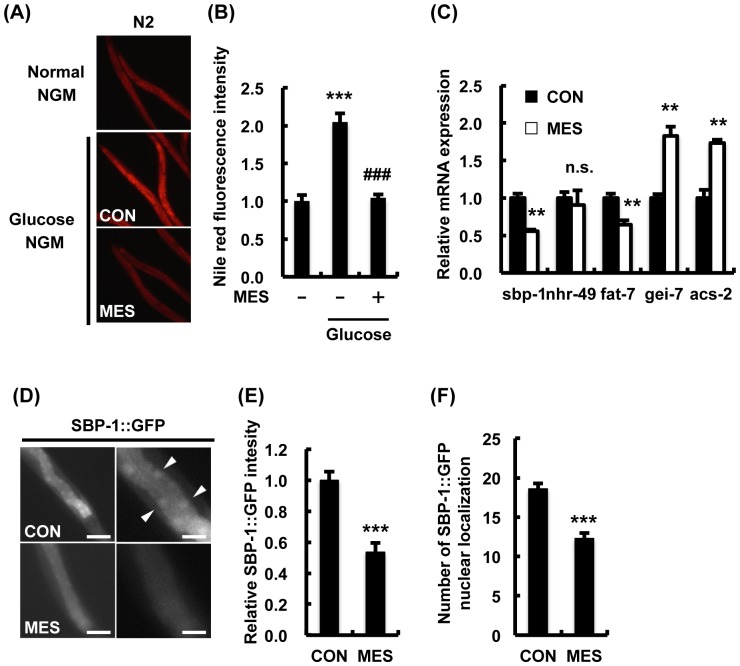
Figure 2. MES suppresses excess fat accumulation in wild type N2 worms.
(A) N2 worms were bred on NGM plates with or without D-glucose (10 mM) and treated once a day with MES (0.1 ms, 2 V/cm, 55 pps) for 20 min at larval stage. After the last treatment, worms were stained with Nile red and observed under a fluorescent microscope. (B) Relative fluorescent intensity of Nile red in (A) was quantified. Data are presented as mean ± SE. ***P<0.001 versus control without D-glucose, ###P<0.0001 versus control with D-glucose, assessed by one-way ANOVA. (C) Wild type N2 worms were bred on NGM plates with glucose (10 mM) and treated once a day with MES for 20 min at larval stage. After the last treatment, total RNA was extracted and subjected to quantitative real-time PCR. The mRNA levels were normalized to the level of β-actin (internal control). Data are representative of two independent experiments using approximately 200 animals per group. Data are presented as mean ± SE. **P<0.01 versus control, assessed by unpaired t-test. n.s., not significant. (D) Worms expressing SBP-1::GFP reporter were treated once a day with MES for 20 min at larval stage. After the last treatment, images of GFP were obtained using a fluorescent microscope. Scale bar in left panels, 100 µm; right panels, 25 µm (E) Percentage of worms with GFP nuclear localization (white arrowhead in (D)) and (F) number of GFP nuclear foci were quantified. Data are presented as mean ± SE. ***P<0.001 versus control, assessed by unpaired t-test. For fluorescence experiments (A–B and D–F), data shown are representative of two independent experiments using 40–50 animals per group.

