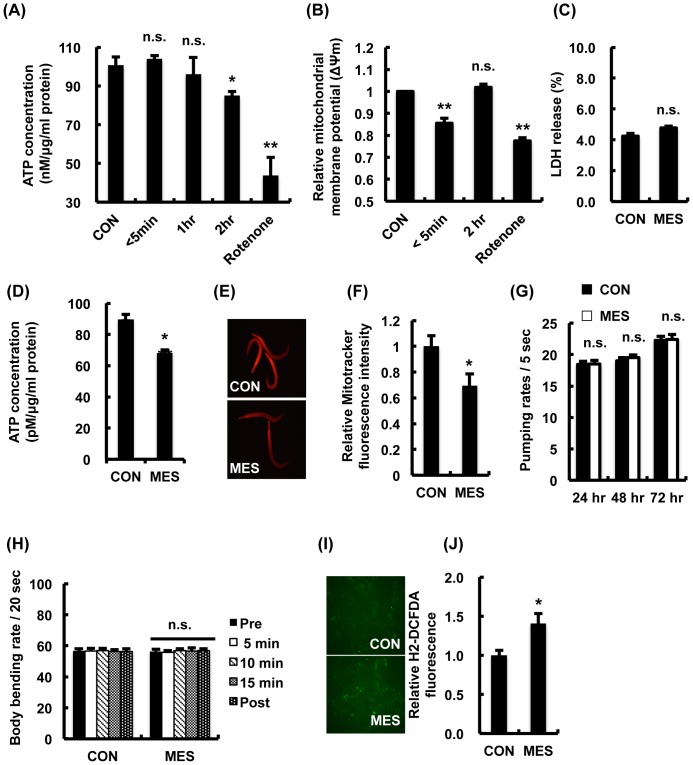
Figure 6. MES transiently decreases mitochondrial membrane potential.
(A) Differentiated L6 cells were treated with MES (0.1 ms, 1 V/cm, 55 pps) for 10 min. Then cells were incubated for the indicated time and stained with mitochondrial membrane potential sensor JC-1. Stained cells were subjected to flow cytometry. Rotenone was used as negative control. Data are presented as mean ± SE. **P<0.01 versus control, n.s., not significant, assessed by one-way ANOVA. (B) Differentiated L6 cells were treated with MES for 10 min. Then cells were incubated for the indicated time and subjected to ATP assay. Rotenone was used as negative control. Data are presented as mean ± SE. *P<0.05, **P<0.01 versus control, n.s., not significant, assessed by one-way ANOVA. (C) Differentiated L6 cells were treated with MES for 10 min. LDH release was assessed 24 hr after MES treatment. Data are presented as mean ± SE. n.s., not significant. (D) Wild type N2 worms were treated once a day with MES for 20 min at larval stage. After the last treatment, worm lysates were extracted and subjected to ATP assay. Data are presented as mean ± SE. **P<0.01 versus control. (E) Wild type N2 worms were treated once a day with MES for 20 min at larval stage. After the last treatment, worms were stained with Mitotracker Red CMXRos and observed under a fluorescent microscope. (F) Relative fluorescent intensity of Mitotracker Red CMXRos in (E) was quantified. Data are presented as mean ± SE. *P<0.05 versus control, assessed by unpaired t-test. (G) Wild type N2 worms were treated once a day with MES (0.1 ms, 2 V/cm, 55 pps) for 20 min at larval stage. After each treatment, we recorded and counted the number of pharyngeal pumping activity per 5 seconds for individual worms placed in NGM plates. Data are presented as mean ± SE. n.s., not significant. (H) Wild type N2 worms were treated once a day with MES for 20 min at larval stage. After the last treatment, we recorded at 0, 5, 10, 15, 20 min and counted the number of body bends per 20 seconds for individual worms placed in M9 buffer. Data are presented as mean ± SE. n.s., not significant. (I) Differentiated L6 cells were treated with MES (0.1 ms, 1 V/cm, 55 pps) for 10 min and then cells were stained with ROS indicator H2-DCFDA and observed under a fluorescent microscope. (J) Relative fluorescent intensity of H2-DCFDA in (I) was quantified. Data are presented as mean ± SE. *P<0.05 versus control, assessed by unpaired t-test. For (A-J), data shown are representative of two independent experiments.

