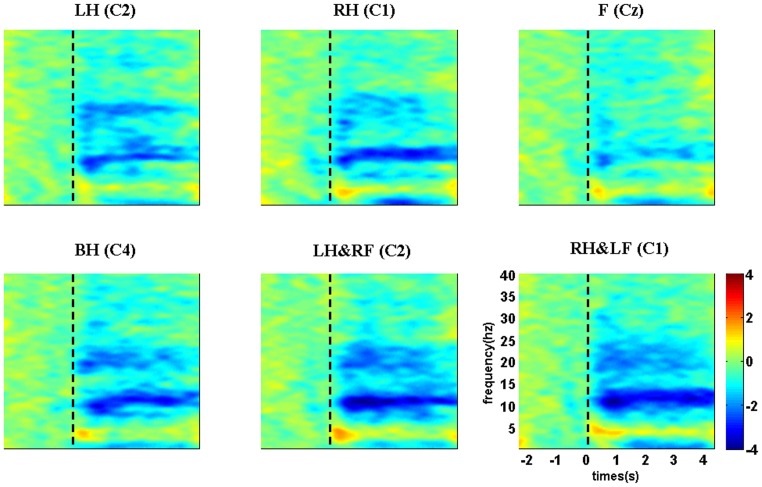
Figure 2. Examples of group-level average time-frequency maps at typical electrode locations for six MI tasks.
LH, RH, F, BH, LH&RF, RH&LF indicate left hand, right hand, feet, both hands, left hand combined with right foot, right hand combined with left foot respectively. Blue indicates ERD and red indicates ERS, vertical dashed line indicates stimulus onset.

