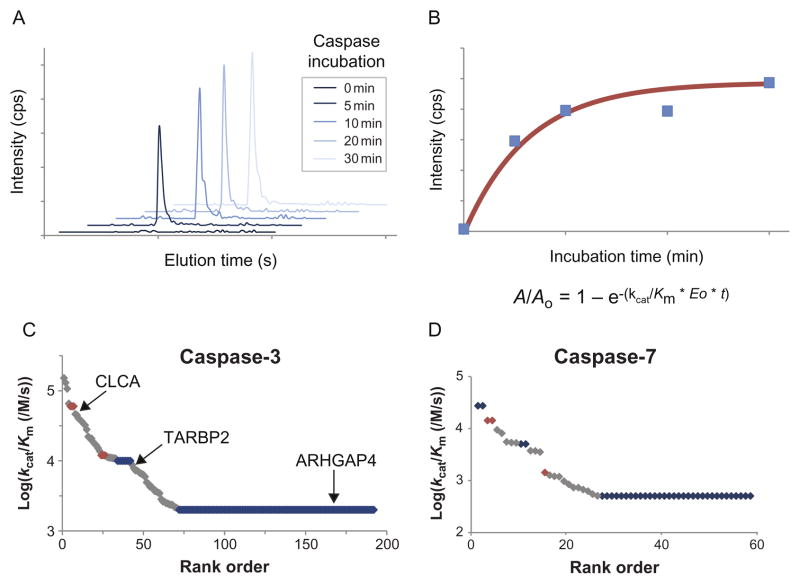
Figure 13.5.
Monitoring kinetics of recombinant caspase cleavage. (A) SRM transitions show increase in intensity across time course after caspase addition. (B) Peptide intensities are fit to pseudo-first-order kinetic equations to determine kinetic efficiency (kcat/Km) for each substrate. (C and D) Rank order of catalytic efficiencies for substrates of caspases-3 and -7 span at least two orders of magnitude. Caspase-3 plot indicates substrates with rapid, medium, and slow cleavage. Figure adapted from Agard et al. (2012) with permission of the authors.

