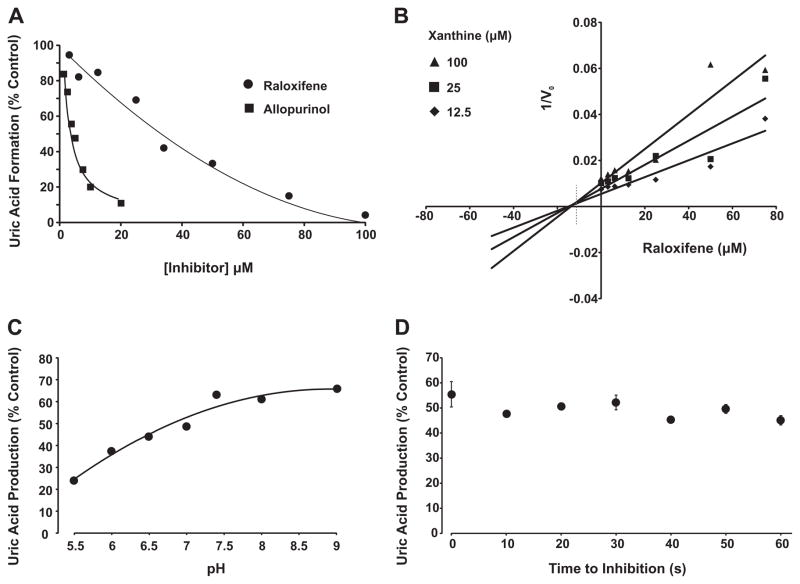
Fig. 1.
Raloxifene inhibition of XO. (A) Purified xanthine oxidase (2 mUnits/ml, phosphate buffered saline, pH 7.4) was exposed to various concentrations of either raloxifene or allopurinol and assessed for formation uric acid (λ = 295 nm) upon the addition of xanthine (100 μM). Shown are the initial reaction rates (V0) plotted as % control (no inhibitor). (B) Purified xanthine oxidase (as above) was exposed to various concentrations of raloxifene and assessed for formation uric acid (λ = 295) using 3 concentrations of xanthine (12.5, 25, and 100 μM). Shown is a Dixon plot (1/V0 vs. [inhibitor]) generating an inhibition constant (Ki) = 13 μM for raloxifene and demonstrating a competitive inhibition process defined as line intersection above the abscissa (dashed line). (C) Purified xanthine oxidase (as above) was exposed to a single concentration of raloxifene (37 μM) and assessed for the effect of pH (5.5–9.0) on inhibition capacity. (D) Purified xanthine oxidase (as above) was exposed to a single concentration of raloxifene (37 μM) and assessed for time to inhibition (0–60 s). For (A–C), data represent the mean of at least 4 independent determinations. For (D), data represent the mean and standard deviation of at least 3 independent determinations with no significant difference observed at 95% confidence, p > 0.05.

