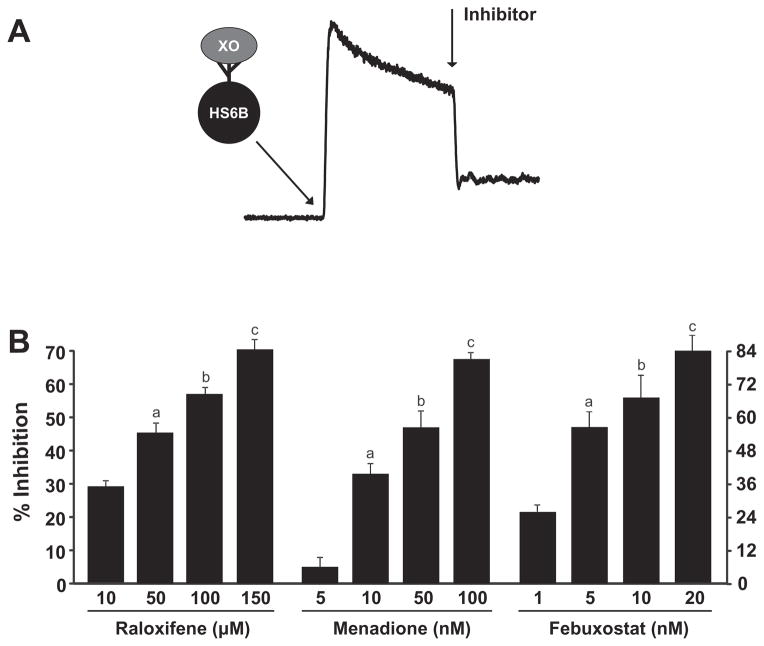
Fig. 2.
Inhibition of XO-catalyzed reduction to •NO. (A) Diagram depicting a typical experiment where HS6B-XO (final concentration = 1.5 mUnits/mL) was added to the reaction vessel of the Nitric Oxide Analyzer containing 1 mM and 20 μM xanthine. After establishment of a rate of •NO generation, the inhibitor was added. All inhibitors were added at the same time after the addition of HS6B-XO (B) Inhibition profiles for raloxifene, menadione, and febuxostat generating EC50 values of 64 μM, 60 nM and 4 nM, respectively. For raloxifene a–c are significantly different from 10 μM as well as between groups p < 0.05. For menadione a–c are significantly different from 5 nM as well as between groups p < 0.05. For febuxostat, a–c are significantly different from 1.0 nM, p < 0.05 and a is significantly different from c, p < 0.05.

