
Fig 3. Serological analysis of immunized macaques.
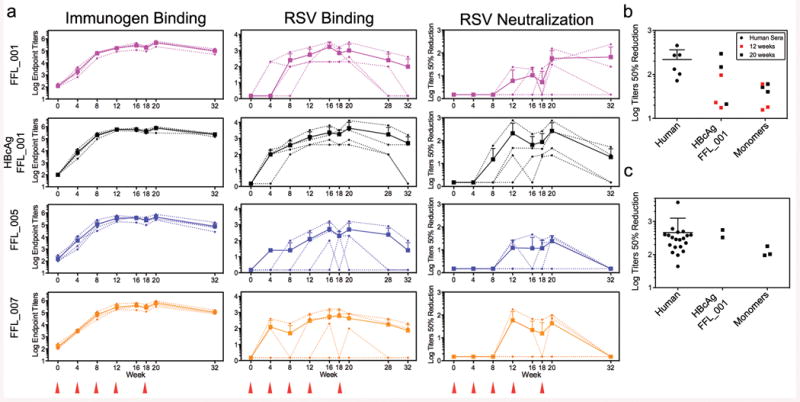
a, ELISA endpoint titers measured against the autologous immunogen (left) or against RSV whole viral lysate (middle), and 50% neutralization titers as determined by the plaque reduction assay (right). The immunization groups are shown at far left, and the schedule is indicated at the bottom. Small symbols connected with dashed lines indicate individual animals. Large symbols connected with solid lines report group averages, with error bars showing standard deviations, measured over the four animals in each group at each time point. b, Comparison of 50% neutralization titers for sera from six RSV-seropositive humans and sera from eight macaques from weeks 12 and 20, measured side-by-side in the plaque reduction assay. Mean ± standard deviation for the human data are 218 ± 145. Two macaque data points at both week 12 and 20 are not visible in the graph because no neutralizing activity was detected. c, Comparison of 50% neutralization titers for sera from twenty RSV-seropositive humans and sera from five macaques from week 20, measured side-by-side in the flow cytometry assay. Mean ± standard deviation for the human data are 462 ± 792.