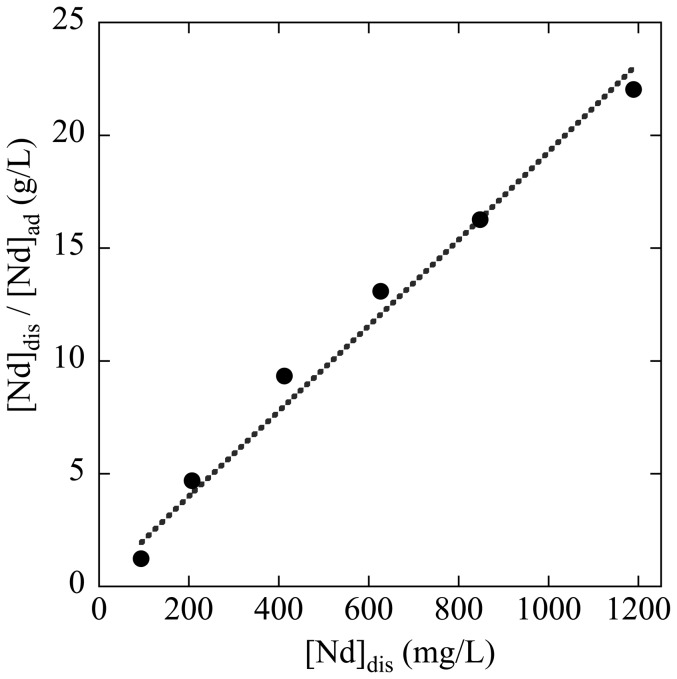
Figure 2. Relationship between [Nd]dis and [Nd]dis/[Nd]ad (Langmuir function).
[Nd]dis and [Nd]ad denote the equilibrium concentrations of Nd in the aqueous and solid (salmon milt powder) phases, respectively, obtained at various initial Nd concentrations. A linear line obtained by least-square fitting is also shown (r2 = 0.99992) to estimate the maximum adsorption of Nd onto the salmon milt powder.

