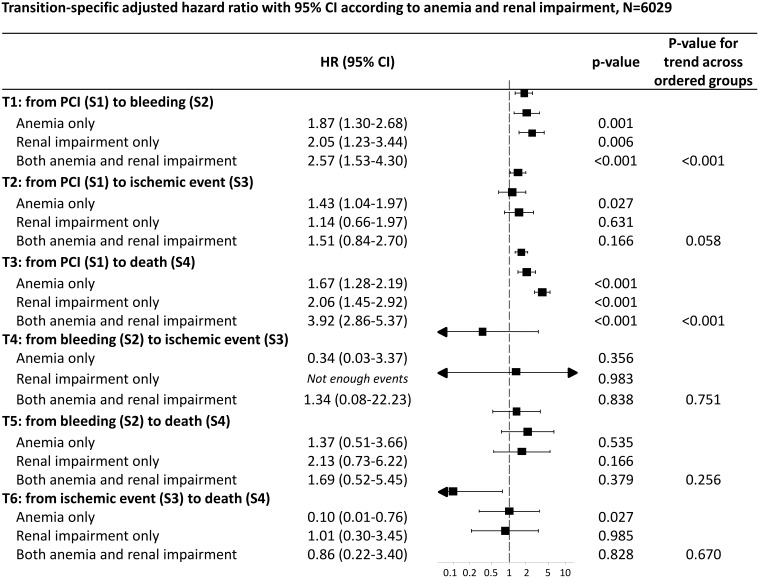
Figure 3. shows the transition-specific adjusted hazard ratios with 95% CI according to anemia and renal impairment using Cox proportional hazard models within a multi-state analysis.
Adjustment for type of stent, age, gender, diabetes, hypertension, dyslipidemia, LV function, acute coronary syndrome. Reference: patients with no renal impairment and no anemia. P-value for trend estimated considering ordered groups.

