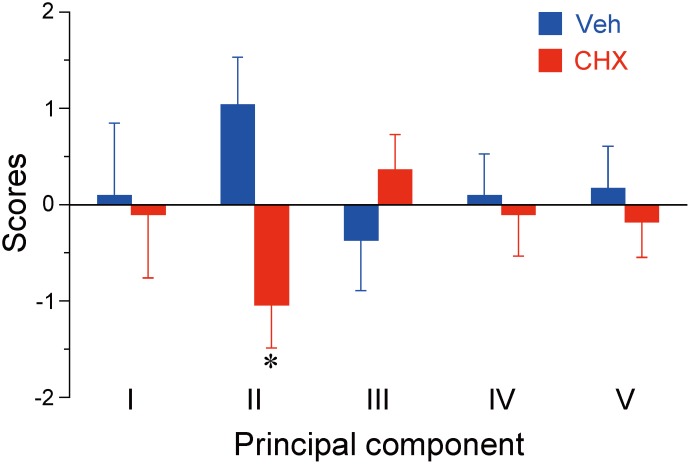
Fig 4. Principal component scores derived from principal component analysis (PCA) of the behavioral variables.
The scores were calculated for individual animals administrated saline or 2-cyclohexen-1-one (N = 9/each) using loadings derived from PCA. Data represent the mean ± SEM. *p < 0.05 (Bonferroni’s corrected α-value of 0.01) compared with control (Veh).

