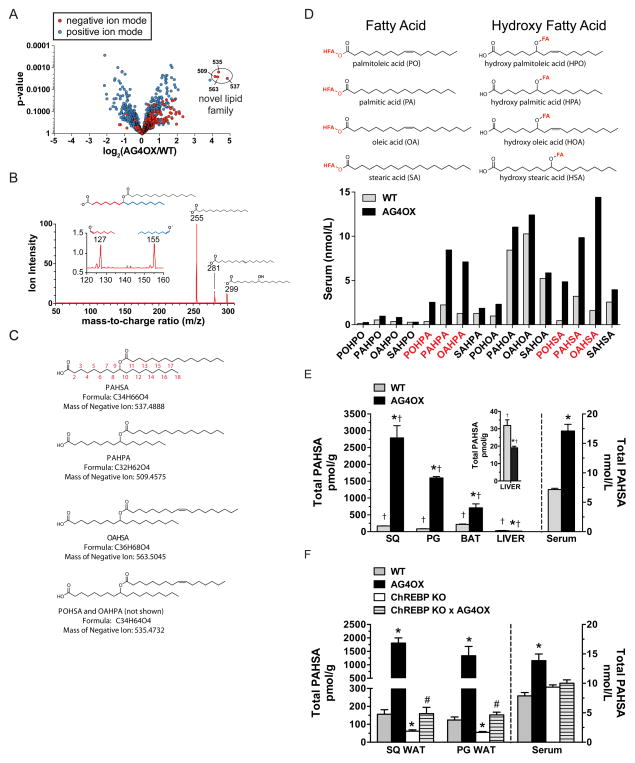
Figure 1. Discovery and characterization of a class of lipids (FAHFAs).
A) Comparative lipidomics of SQ white adipose tissue (WAT) from AG4OX and WT mice reveals the presence of a group of ions at m/z 509 (PAHPA), 535 (POHSA/OAHPA), 563 (OAHSA) and 537 (PAHSA) that are elevated 16–18-fold in AG4OX mice. B) Structural analysis of the 537 ion from AG4OX WAT by tandem MS demonstrates that it is composed of palmitic acid (m/z 255) and hydroxy stearic acid (m/z 299). Octadecanoic acid (m/z 281) results from the dehydration of hydroxy stearic acid. Fragmentation at high collision energies produces two ions at m/z 127 and 155, identifying carbon 9 as the position of the hydroxyl group on hydroxy-stearic acid, confirming the structure to be 9-PAHSA. C) Acyl chain carbon numbering scheme, molecular formula, mass and names of FAHFAs from the m/z 537 (PAHSA), m/z 509 (PAHPA), m/z 563 (OAHSA) m/z 535 (POHSA or OAHPA) ions. D) Constituent fatty acid and hydroxy-fatty acid components of FAHFAs. Quantification of 16 FAHFA family members identified in serum of WT and AG4OX mice. E) Total PAHSA levels in serum and tissues of WT and AG4OX mice. Inset, liver total PAHSA levels. n=3–5/group, *p<0.05 versus WT (t-test), †p<0.05 versus all other tissues within the same genotype (ANOVA). F) Total PAHSA levels in SQ-WAT, PG-WAT and serum of WT, AG4OX, ChREBP KO and AG4OX/ChREBP KO mice. n=3–5/group, *p<0.05 versus all other genotypes within same tissue or serum (ANOVA), # p<0.05 versus AG4OX and ChREBP-KO. Data are means±sem.

