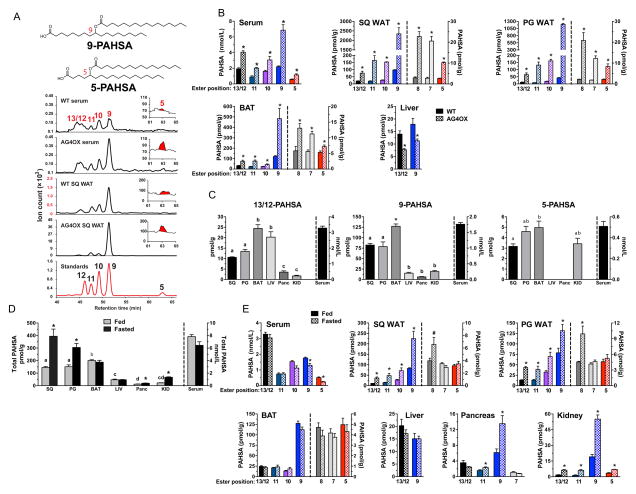
Figure 2. Identification and quantification of PAHSA isomers in mouse serum and tissues.
A) Co-elution of PAHSA isomers from serum and SQ WAT of WT and AG4OX mice with synthetic standards for individual PAHSA isomers. The peak for 5-PAHSA is shown in red in the inset. B) Distribution and quantification of PAHSA isomers in serum and tissues of WT and AG4OX mice. ‘Ester position’ refers to the location of the ester bond in PAHSA isomers. n=3–5/group, *p<0.05 versus WT (t-test). C) Distribution and quantification of 13/12-, 9- and 5-PAHSA isomers in serum and tissues of WT female FVB mice. n=3–5/group, a,b,c Tissues with different letters are different from each other within the same isomer panel (p<0.05, ANOVA). D) Total PAHSA levels and E) PAHSA isomer levels in serum and tissues of WT mice in fed or fasted (16 h) states. *p<0.05 versus fed (t-test). ‘Ester position’ refers to the location of the ester bond in PAHSA isomers. n=3–5/group, *p<0.05, #<0.07 versus fed (t-test) a,b,c,dTissues with different letters are different from each other for the fed state (p<0.05, ANOVA). Data are means±sem. See also figure S1.

