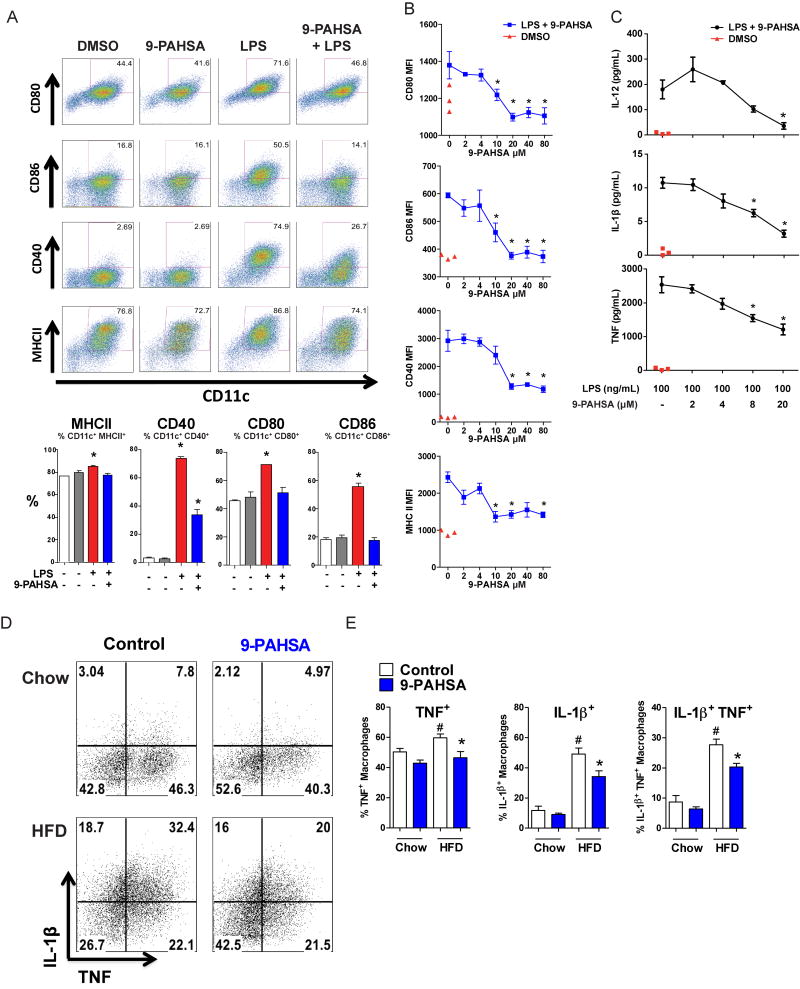
Figure 7. 9-PAHSA inhibits LPS-induced dendritic cell maturation in vitro and pro-inflammatory cytokine production from adipose tissue macrophages in vivo.
A) LPS induces dendritic cell (DC) maturation (increased percentage of CD11c+ cells expressing co-stimulatory molecules, CD80, CD86, CD40, and MHCII). This LPS effect is reduced in the presence of 9-PAHSA (40 μM) compared to vehicle (DMSO) control. Quantification of CD11c+ cells which are positive for co-stimulatory molecules from the panel above. n=3 mice/group. B) LPS–induced DC maturation is inhibited by increasing concentrations of 9-PAHSA. Red triangles represent vehicle for 9-PAHSA (DMSO) without LPS. MFI: median fluorescence intensity. n=3 mice/group, C) LPS–induced cytokine secretion from DC’s is inhibited by increasing concentrations of 9-PAHSA compared to vehicle for 9-PAHSA (DMSO, ‘-’) control. Red triangles represent vehicle for 9-PAHSA (DMSO, ‘-’) without LPS. n=3 mice/group. D) Flow cytometry representation of AT macrophages expressing TNFα and IL-1β. Mice fed on HFD or chow mice were gavaged for 3 days with 9-PAHSA (30mg/kg for chow mice and 45mg/kg for HFD mice) or vehicle control. PG-WAT was harvested on day 4 and the stromal vascular cells were incubated in vitro with PMA, ionomycin and brefeldin for 5 hours. AT macrophages (CD45+CD11b+F4/80+) were stained intracellularly for TNFα and IL-1β. E) Quantification of panel D percentage of AT macrophages expressing TNFα, IL-1β or both. n=5 mice/group. LPS concentration is 100ng/ml for all panels. *p<0.05 versus LPS-activated cells without PAHSA treatment (A-C) or control cells, same diet (E) by one-way (A-C) and two-way ANOVA (D). #p<0.05 versus all other groups by two-way ANOVA. Data are means±sem. See also figure S5.

