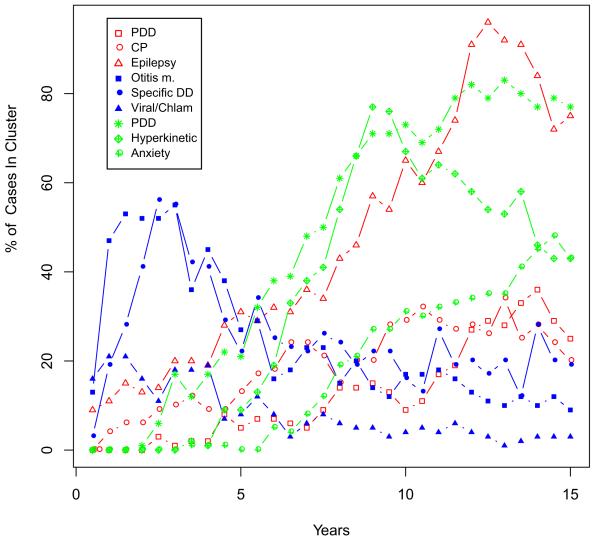
Figure 2.
Trajectories of Comorbidities Characterizing Three Distinct Sub-clusters of ASD Defined by Electronic Health Record Data. Shown in red are the top three co-morbidities from cluster 1 where seizures rise to a prevalence of 80%. Shown in blue are the top three co-morbidities from cluster 2 with an early childhood peak of infections. Not shown (because lower ranked) is a rise in inflammatory bowel disease that continues to rise through adolescence. Shown in green are the top three co-morbidities in cluster 3 which are characterized by anxiety and hyperkinetic activity. Not shown (because lower ranked) is a rise in schizophrenia that accelerates with onset of adolescence.

