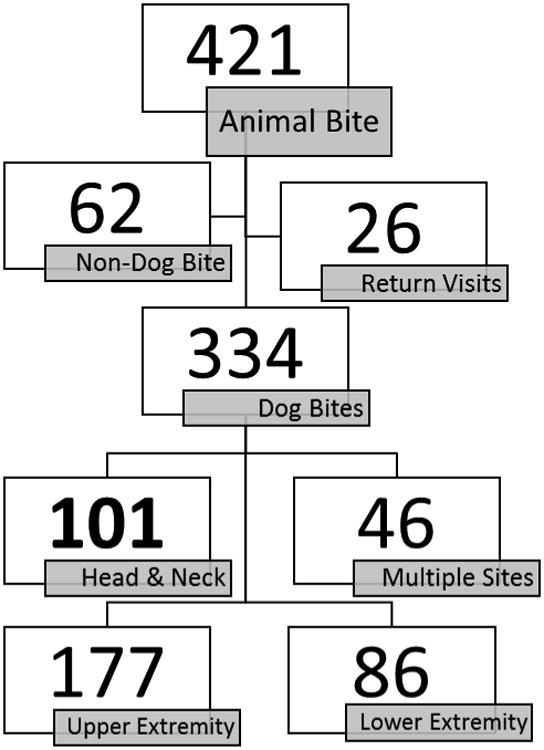
Figure 1. Flow Chart of Enrolled Patients.

This flow chart graphically displays how select patients were removed for data collection and analysis.

This flow chart graphically displays how select patients were removed for data collection and analysis.