
Figure 3.
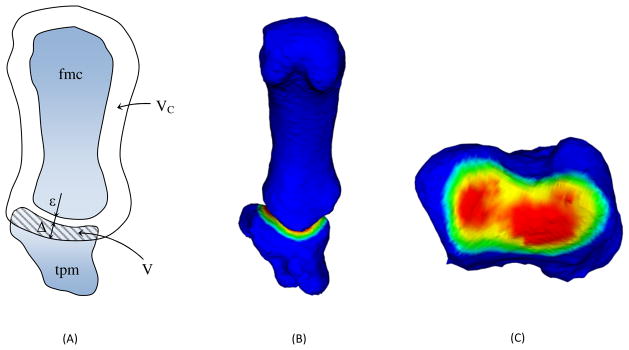
Schematization of the Winkler-based congruence measure: cross section showing the control volume, the offset threshold and the minimum joint space ε (A); 3D representation of the intersection volume (B); view of the trapezium (tpm) subchondral area, colored proportionally to its distance from the first metacarpal (fmc) subchondral surface (C).