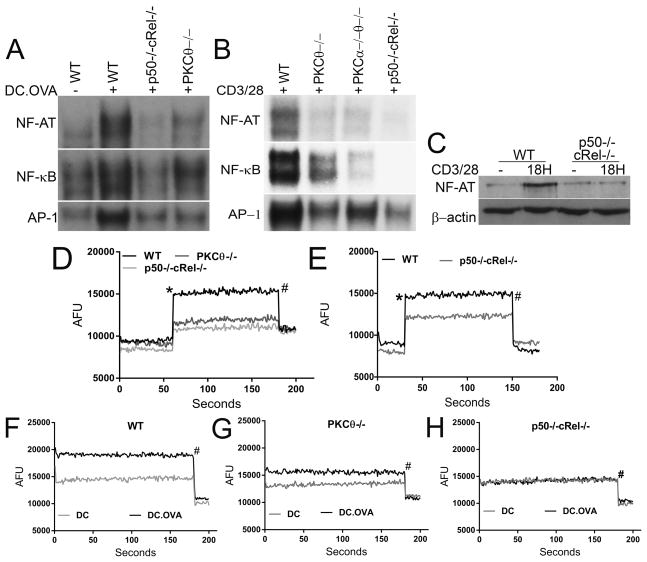
Figure 2. p50−/−cRel−/− T cells have defects in NFAT and AP-1 activation and calcium influx.
(A) Unstimulated and stimulated OT-1 WT, PKCθ−/− and p50−/−cRel−/− CD8+ T cells after 18 h culture with DC and OVA were used to prepare nuclear lysates and EMSA was performed to detect NF-κB, NFAT and AP-1. (B) Same as (A) except polyclonal WT, PKCθ−/−, PKCα−/−PKCθ−/− and p50−/−cRel−/− CD8+ T cells were used, and stimulated with 1 μg/mL anti-CD3/CD28 for 18 h. (C) Western blotting to determine NFATc1 in nuclear fraction of WT and p50−/−cRel−/− CD8+ T cells unstimulated or stimulated with 1 μg/mL CD3/CD28 for 18 h. (D) WT, PKCθ−/−, and p50−/−cRel−/− polyclonal CD8+ T cells were analyzed for the ability to influx calcium: the first 60 s represent a baseline after which the following components were added to the culture: (*)10 μg/mL CD3/CD28 and (#) 9 mM EGTA. Points are Arbitrary Fluorescent Units (AFU) and lines represent one of three repeats within each assay. (E) Same as (D) except polyclonal CD8+ cells were cultured for 48 h with 1 μg/mL CD3/CD28, rested for 2 h, and then assayed for calcium after anti-CD3/CD28 treatment. (F–H) Same as (D) except OT-1 T cells were used and graphs compare calcium influx based on T-cell:DC interaction ± OVA. (A–H) Data are from one experiment (n=4 mice/genotype/pooled and spread across treatments), representative of three independent experiments.

