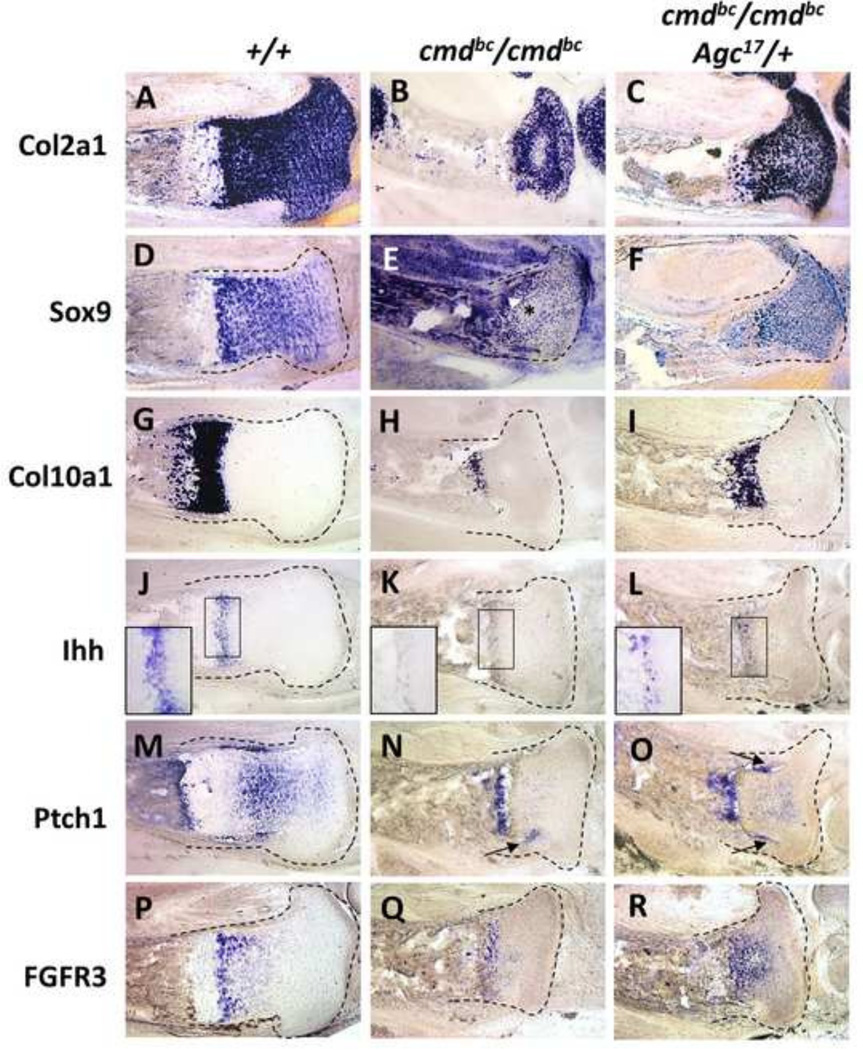
Figure 4. Expression pattern of growth plate transcripts by mRNA in situ hybridization.
Representative expression analyses of Col2a1 (A–C), Sox9 (D–F), Col10a1 (G–I), Ihh (J–L), Ptch1 (M–O), and Fgfr3 (P–R) transcripts in 18.5 dpc tibia sections from wild-type, mutant, and rescue embryos. The panels demonstrating Ihh data contain insets that enlarge the prehypertrophic/hypertrophic zone of expression. Results were observed consistently in five independent experiments with at least four embryos for each mRNA probed. In situ hybridizations with DIG-labeled RNA probes were performed on 40 µm sections; cartilage elements are outlined for clarity.

