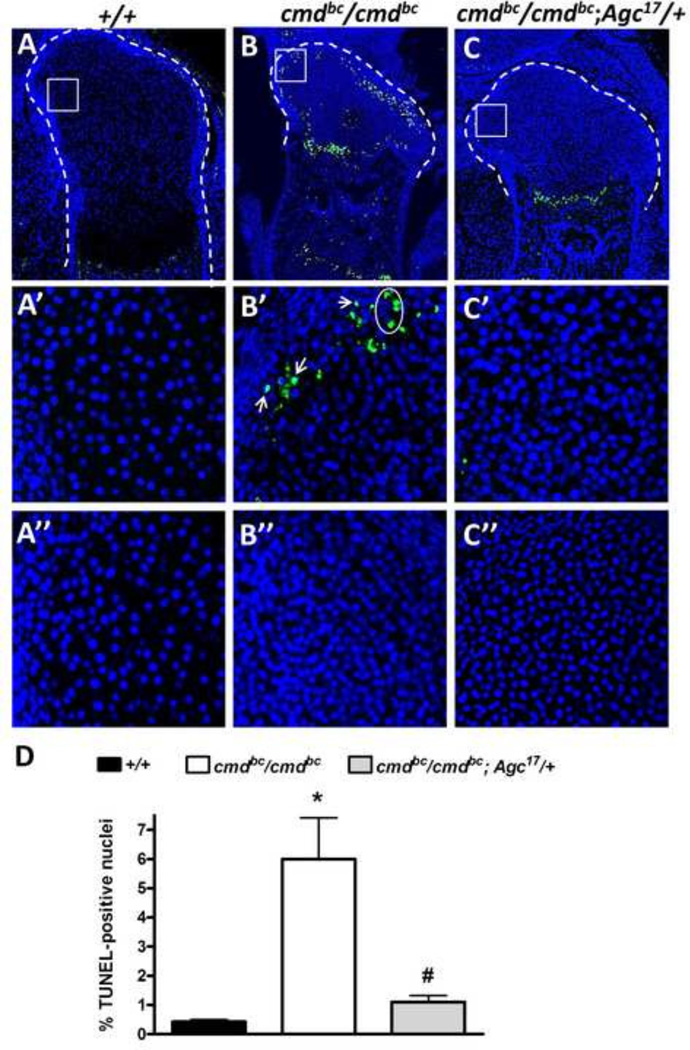
Figure 5. Patterns of cell death in the growth plate of mutant and rescue embryos.
Paraffin sections of 18.5 dpc embryonic femurs were analyzed for apoptotic cells using TUNEL staining. Cartilaginous element limits are outlined in white. (A–C) Increased numbers of apoptotic cells are present in mutants, an occurrence not found in rescue embryos. (A’–C’) Higher magnification of the white boxes outlined in A–C, demonstrating the aberrant cell death occurring in the resting zone of mutants but not in wild-type or rescue embryos. (A’’–C’’) Negative control images of resting zone areas outlined. (D) Quantification of total TUNEL-positive cells in the growth plate. n=3–6 embryos/genotype, *p<0.001 vs. +/+, #p<0.001 vs. cmdBc/cmdBc, one-way ANOVA with Tukey’s post-hoc testing.

