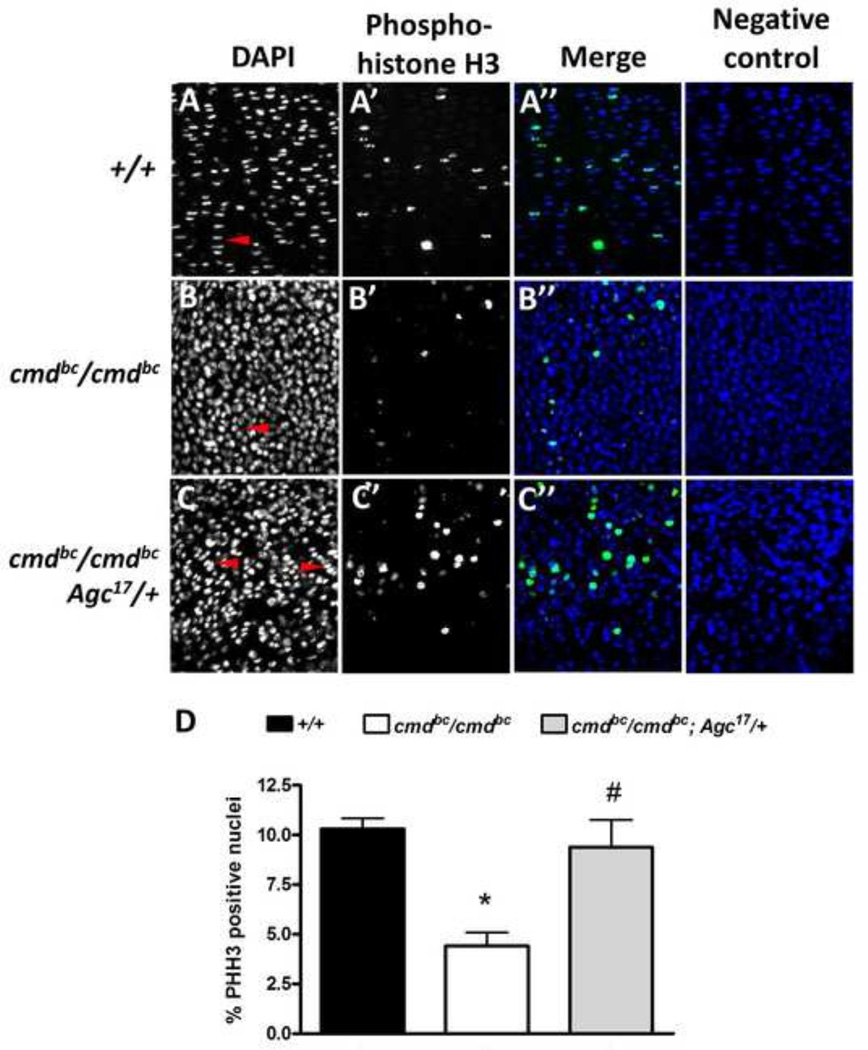
Figure 6. Proliferation in mutant and rescue embryonic growth plates.
Embryonic femurs 18.5 dpc stained with DAPI and anti-phospho-histone H3 (PHH3) for analysis of mitotic chondrocytes within the proliferative zone. (A–C) DAPI-stained proliferative chondrocytes demonstrate partial columnar formation in rescue embryos (red arrow heads) compared to mutants. (A’’–C’’) Merged images show that rescue proliferative chondrocytes include double the percentage of pHH3-staining cells in the growth plate compared to mutants, which is comparable to wild-type levels. (D) Quantification of pHH3-positive proliferative chondrocytes in the growth plate. n=3–6 embryos/genotype, *p<0.001 vs. +/+, #p<0.01 vs. cmdBc/cmdBc, one-way ANOVA with Tukey’s post-hoc testing.

