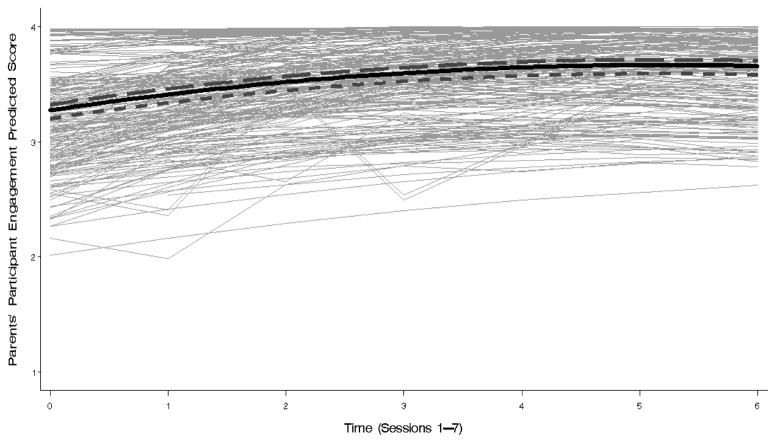
Figure 2.
Changes and Differences in Parent Engagement across Sessions. Predicted trajectory for the prototypical parent is indicated by the solid bold line, indicating increases in engagement across session with some deceleration as the program progressed. Dashed lines indicate how parents with high (+1SD = short dash) levels of chronic family tension have lower initial levels of engagement compared to parents with low (minimum sore of −0.298 = long dash) levels of chronic family tension. Thin, gray lines depict parent-specific predicted trajectories based on final model (Model 2).

