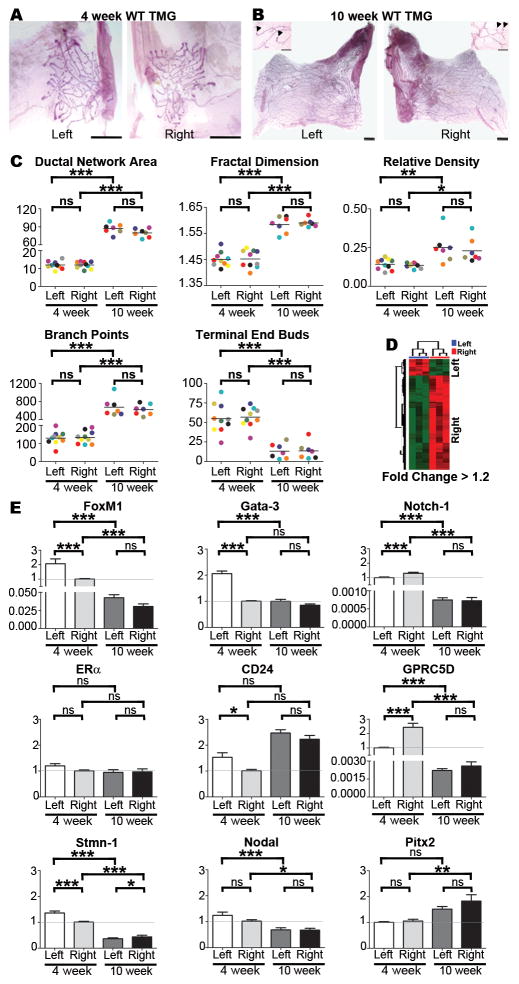
Figure 1. Morphological and molecular analysis of TMGs.
Wild type mouse TMGs such as the representative L-R matched pairs shown at 4-weeks (A) and 10-weeks (B) were processed as carmine red stained whole mounts and composite images were manually traced, isolated, and converted to 8-bit gray scale images for analysis with MetaMorph® image analysis software (scale bar = 1mm). Thresholds and the total area of ductal networks were determined by the integrated morphometry analysis subroutine, and the fractal dimension, a measure of complexity of the network’s morphology, was determined using HarFa analytical software by applying the box counting method (12). Branch points and terminal end buds (TEBs), which are shown in higher magnification insets for 10-week glands (arrowheads indicate TEBs; scale bar = 5 μm), were quantified by manual counting. Color-coding can be used to follow matched L-R pairs harvested from the same mouse in all graphs. No significant L-R differences (C) were found in ductal network area, fractal dimension, relative density, branch points or TEBs at 4 or 10 weeks as determined by one-tailed paired student’s t-test. Microarray analysis of left versus right TMGs (D) using left as the baseline reference was performed using RNA pooled from 3–4 intact 4-week TMGs [#3 and #8 glands as diagrammed in Veltmaat et al (41)] for cDNA synthesis and hybridization to Affymetrix GeneChip Mouse Genome 430 2.0 Arrays. The arrays were preprocessed and normalized using RMA (42). Each array experiment was completed in biological and technical triplicate. Differentially expressed probesets were identified based on a fold-change (increase or decrease in right side compared to left) of at least 1.2, and a q-value of less than 0.05. Pathway analysis was carried out for each set of laterality associated genes (left or right) by probing the NCI Pathway interaction database (43). SYBR Green-based qRT-PCR of select array candidates was performed with primers listed in Table S2 (E). Real-time PCR miner was used to calculate Ct values and replication efficiency(44) and fold changes relative to GAPDH mRNA were determined by delta-delta Ct. Fold changes across groups were determined using the lower level of 4-week expression as baseline as indicated by the horizontal grey line. Bars represent mean ± SEM of ≥5 mice; *p<0.05, **p<0.01; *** p<0.001 (two-tailed paired student’s t-tests).

