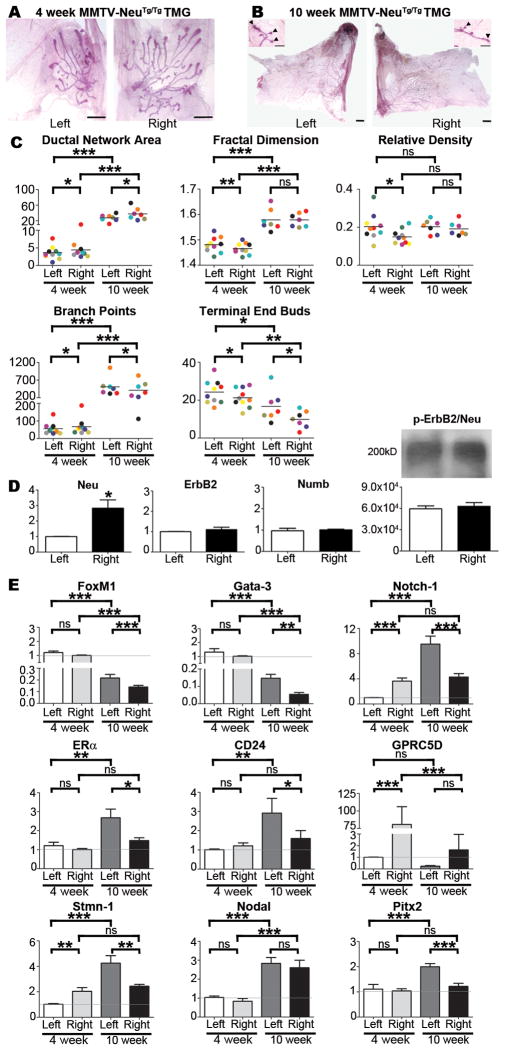
Figure 2. Morphological and molecular analysis of MMTV-cNeuTg/Tg TMGs.
TMGs from MMTV-cNeuTg/Tg mice such as the representative L-R matched pairs shown at 4-weeks (A) and 10-weeks (B) were processed for morphometric analysis and data for matched L-R pairs in individual mice were color coded as described in Fig. 1 and tested by Grubb’s Outlier test, which indicated an absence of outliers. Ductal network area, fractal dimension, relative density, branch points, and TEBs exhibited significant L-R differences at 4 weeks (C) as determined by one-tailed paired student’s t-test (*p<0.05; **p<0.01). Ductal network area, branch points, and TEBs remained significantly L-R different at 10 weeks (C). SYBR Green-based qRT-PCR showed asymmetric expression of Neu, but symmetric mRNA expression of ErbB2 and Numb (D). Bars represent mean ± SEM. N ≥ 5, *p = 0.003. Results were confirmed with a second primer set listed in Table S1. Total ErbB2/Neu protein was immunoprecipitated from left or right TMGs (Antibody #4290, Cell Signaling), immunoblotted, and probed with anti-phospho-ErbB2/Neu (Antibody #2243, Cell Signaling). Densitometry of triplicate results indicated no significant L-R differences (D). SYBR Green-based qRT-PCR analysis of gene expression in left vs. right TMGs of MMTV-cNeuTg/Tg mice was performed as described in Fig. 1E. Bars represent mean ± SEM of 5 mice, *p<0.05; **p<0.01; *** p<0.001 (two-tailed paired student’s t-tests).

