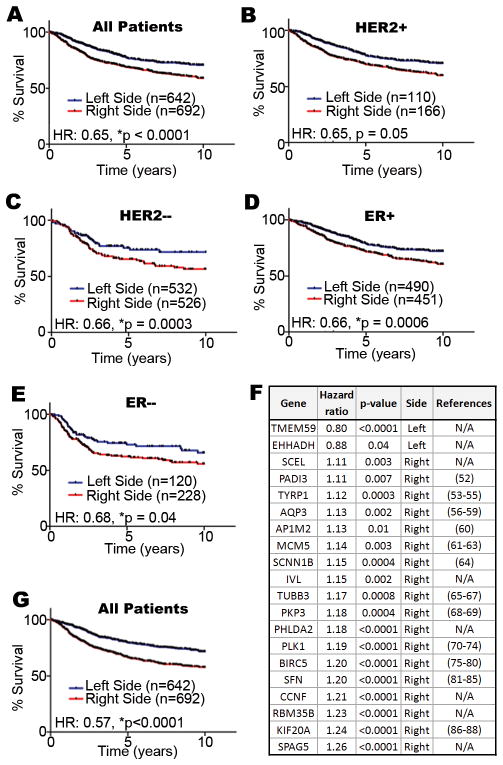
Figure 4. Comparative genomic analysis of mouse L-R mammary gene expression profiles with human breast tumors and the relationship to breast cancer patient survival.
We compiled a large cohort of breast cancer patients from multiple studies available through the Gene Expression Omnibus (http://www.ncbi.nlm.nih.gov/geo/) to test the association between laterality associated genes and patient survival. Hazard ratios (HR) are indicated for all patients (A), and HER2+ (B), HER2− (C), ER+ (D), ER− (E) subsets. A 20-gene subset of the 96 L-R TMG gene expression set (F) is a robust predictor of outcome among all breast cancer patients (G). References are provided for genes previously implicated in oncogenesis; those with none available (N/A) are indicated. Our combined cohort comprised patients from the GSE2034 (45), GSE7390 (46), GSE4922(47), GSE25055 (48), and GSE3494 (49) cohorts (n=1334). For all patients, clinical outcome data as well as the gene expression profile of their respective tumors was available. Whenever possible we used 10-yr disease free survival as the clinical endpoint in our study; however, when disease free survival was not available we alternatively used either distant metastasis free or overall survival as the clinical endpoint. The arrays for each separate cohort were preprocessed and normalized using RMA(42). ER status was assigned based on the clinical annotation files, and HER2 status was assigned based on the mean ERBB2 transcript levels (probe set ID 216836_s_at) within each study cohort independently. Affymetrix GeneChip Mouse Genome 430 2.0 Arrays probe sets were mapped to their human counterpart genes by Unigene IDs. When multiple probe sets recognized the same gene transcripts, only the probe with the highest mean intensity was used. To assign signature scores to patients, the expression values for each gene were standardized such that the mean and standard deviation were set to 0 and 1 in each individual patient cohort, respectively. Subsequently, we calculated signature scores for each patient as previously described (50–51), where positive scores were considered to indicate that a tumor had ‘right-sided’ gene expression and negative scores were considered to indicate that a tumor had ‘left-sided’ gene expression. Survival curves were graphed using Graphpad Prism® 5 and statistical tests were completed in R.

