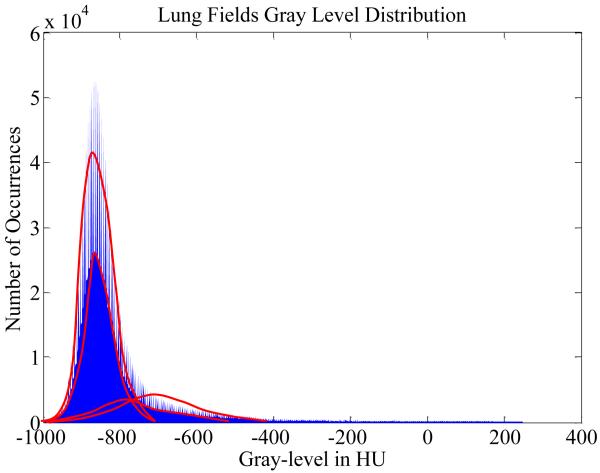
Fig. 5.
Histogram of lung voxel intensities from one chest CT scan of the LIDC datasets. Each bar corresponds to the frequency of observing voxels having intensity within a specific range. Statistically, the observed distribution can be decomposed into four normal-tailed Gaussian mixtures as represented by the four bell-shaped curves.

