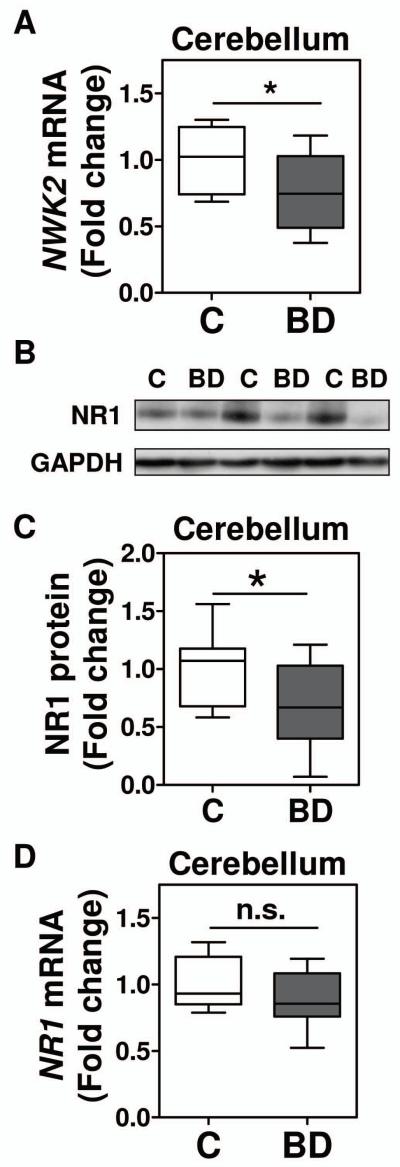
Figure 6. Levels of NWK2 mRNA and NR1 protein are reduced in the postmortem cerebellum from bipolar disorder subjects.
(A) Nwk2 mRNA levels in extracts from cerebellar postmortem tissue of non-psychiatric control subjects (Control, C, n= 10), and subjects with bipolar disease (Bipolar, BD, n=10) were determined by RT-qPCR and normalized to a reference healthy control sample and beta glucuronidase (GUSB). Height of box plots shows interquartile range; horizontal line, median; error bars, range of at least two independent analyses performed in duplicate. Statistical analysis was performed using two-tailed Mann-Whitney test for non parametric values (p<0.05-*). (B, C) NR1 protein levels were determined in protein extracts from cerebellar postmortem tissue of control (Control, C, n= 10), and bipolar disorder subjects (Bipolar, BD, n=10) by immunoblot. The resultant bands were quantified by densitometry. NR1 was normalized to GAPDH values and referred to a standard sample as described in the material and methods. (B) Representative Western blot images for NR1 and GAPDH from three control individuals and three bipolar subjects. (C) The graph shows normalized NR1 protein levels. Each box plot represents median, interquartile range and range of at least two independent analyses. (D) NR1 mRNA levels were determined as in (A). Each box plot represents median, interquartile range and range of an analysis performed in duplicate. An outlier was detected for NR1 mRNA levels in the control group and therefore excluded from the analysis (C, n=9; BP, n=10). Statistical analysis was performed using one-tailed Mann-Whitney test (p<0.05-*; n.s.-not significant).

