Figure 4.
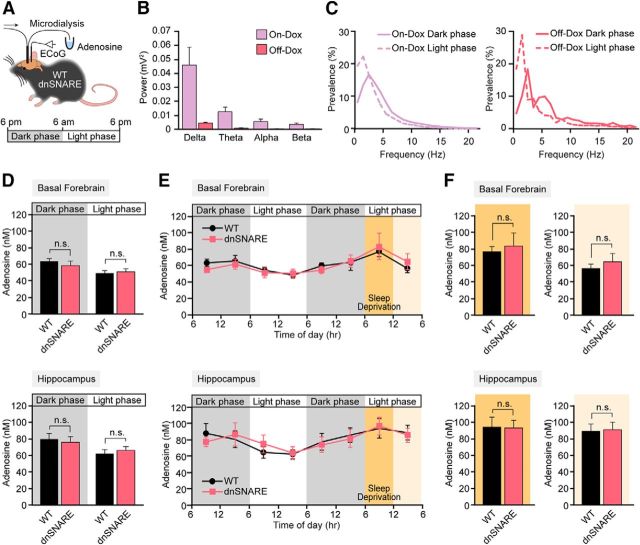
EEG activity pattern and adenosine follow a circadian rhythm in dnSNARE mice. A, Schematic diagram depicting how ECoG recordings and microdialysis samples were collected in freely moving mice. B, Comparison of the raw power spectrum of dnSNARE mice under Off-Dox and On-Dox conditions (n = 5). C, Representative power spectrum analysis show the shift in the percentage prevalence of delta waves between dark and light phase in On-Dox (left) and Off-Dox (right) conditions. D, Comparison of the extracellular concentration of adenosine in wild-type C57BL/6J (WT) and Off-Dox dnSNARE mice during the dark phase or light phase in basal forebrain (top, WT, n = 7; Off-Dox dnSNARE, n = 9) or in hippocampus (bottom, WT, n = 9; Off-Dox dnSNARE, n = 6; p > 0.05, Student's t test compared with WT). E, Adenosine measurements over 48 h in microdialysates collected before, during and after sleep deprivation from basal forebrain (top) and hippocampus (bottom) in WT (basal forebrain, n = 5; hippocampus, n = 7) and in Off-Dox dnSNARE mice (basal forebrain, n = 6; hippocampus, n = 4). F, Adenosine concentrations during sleep deprivation and subsequent recovery sleep periods. No significant difference in adenosine concentrations was observed between WT and Off-Dox dnSNARE mice in either basal forebrain (top left, sleep deprivation period; top right, recovery sleep period; n = 5–6) or hippocampus (bottom left, sleep deprivation period; bottom right, recovery sleep period; n = 5–8). Error bars indicate SEM in B and D–F. n.s., Not significant.

