
Figure 3.
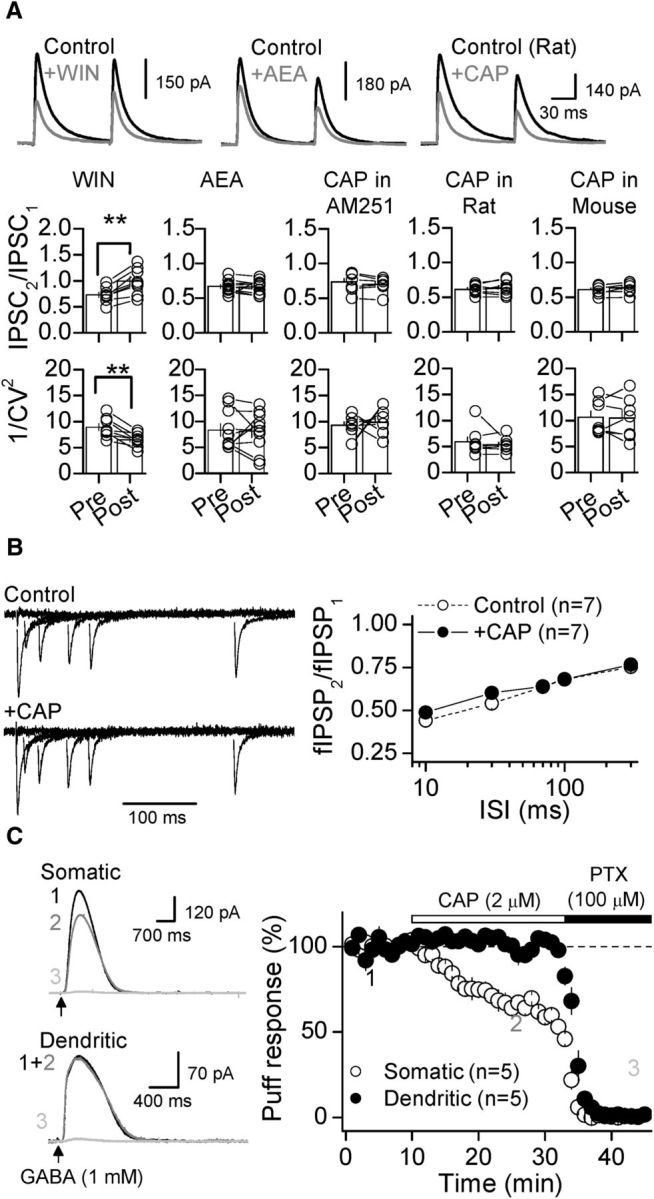
TRPV1-mediated depression of inhibition is postsynaptic. A, Top, Representative traces of two consecutive GABAergic IPSCs (100 ms interstimulus interval) before (black) and after (gray) bath application of WIN, AEA, and CAP. Bottom, Summary plots showing that WIN, but not AEA or CAP, significantly changes the PPR and 1/CV2 of somatic IPSCs. These results were generated from the experiments reported in Figure 1A and D and Figure 2A and C. B, CAP did not alter PPR of fIPSPs recorded as in Figure 1B and measured at different interstimulus intervals (10, 30, 75, 100, and 300 ms). fIPSPs were normalized to the first response. C, Representative traces (left) and summary plot (right) showing that CAP also mediated depression of GABAR-mediated responses evoked by puffing GABA (1 mm, 25 ms) in the DGL (somatic) but not in the middle third of the molecular layer (dendritic). Subsequent application of PTX (100 μm) eliminated the CAP-insensitive component of GABA-evoked responses. In all cases, averaged sample traces taken at times indicated by numbers are shown next to each summary plot. Summary data represent the mean ± SEM. **p < 0.01.