
Figure 5.
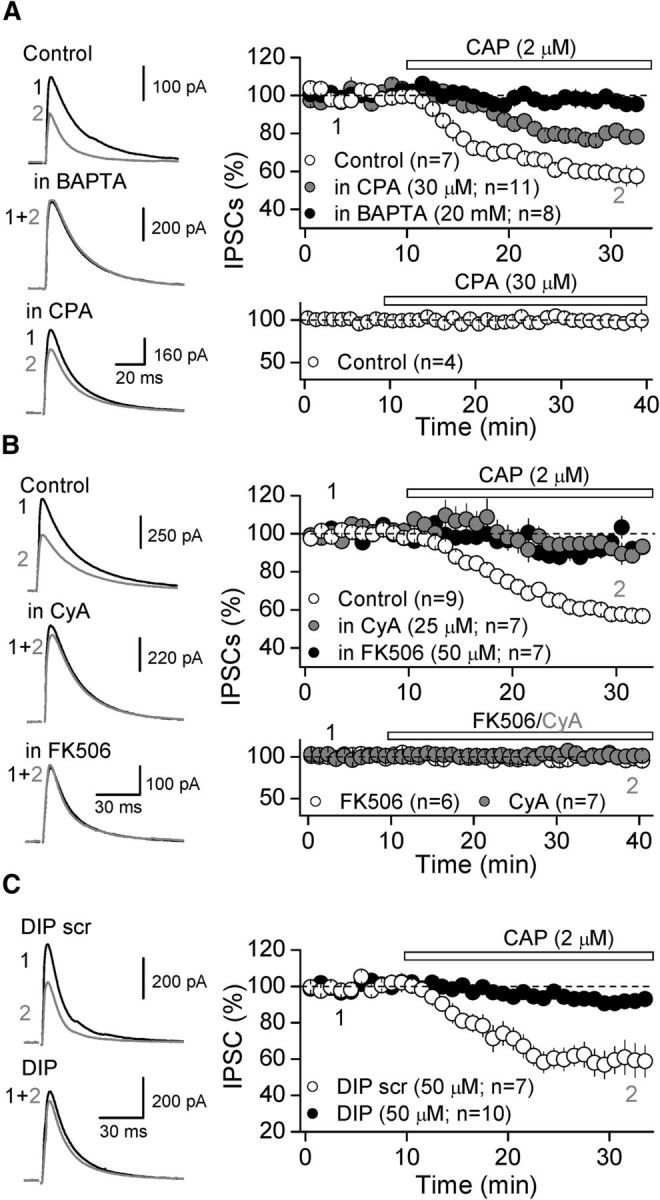
Mechanism underlying TRPV1-mediated depression of inhibitory transmission. A, Representative traces (left) and summary plot (right) showing that loading DGCs with BAPTA (20 mm) completely eliminated, whereas pre-incubation with 30 μm CPA significantly reduces, CAP-mediated depression of GABAergic IPSCs. Note that bath application of CPA for at least 30 min did not affect basal synaptic transmission (bottom). B, Representative traces (left) and summary plot (right) showing that two different calcineurin inhibitors, FK506 (50 μm) and CyA (25 μm), eliminated CAP-mediated depression of inhibition. Bath application of FK506 or CyA for 30 min did not affect GABAergic basal synaptic transmission (bottom). C, Intracellular loading of DIP (50 μm), but not DIP scrambled (DIP scr; 50 μm), eliminated CAP-mediated depression. Averaged sample traces taken at times indicated by numbers are shown next to each summary plot. In all parts, summary data represent the mean ± SEM and the number of cells tested is in parenthesis.