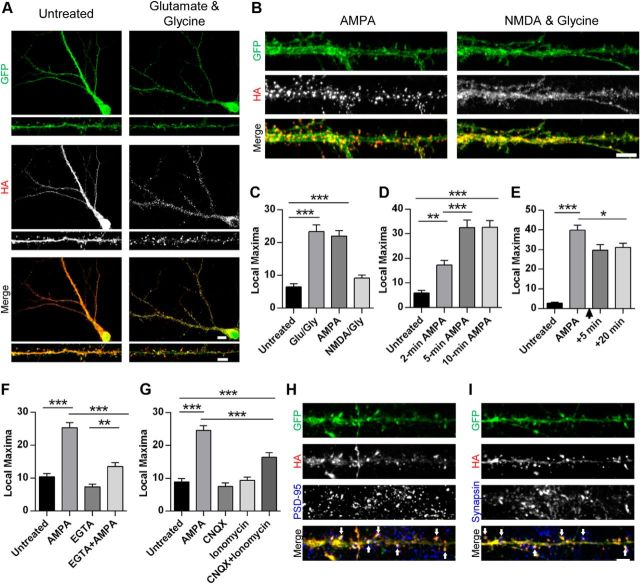
Figure 1.
AMPAR activation leads to rapid redistribution and accumulation of Nedd4-1 at synapses. A, B, Representative immunofluorescent images of dissociated hippocampal neurons 19–22 DIV expressing HA-tagged Nedd4-1 (Sindbis) for 18–20 h and treated with glutamate and glycine (100 μm/10 μm), AMPA (10 μm), or NMDA and glycine (25 μm/10 μm) for 10 min or left untreated and then stained with anti-HA (red) and anti-GFP (green) antibodies. Representative maximum z-projected confocal images of whole cell and dendrite (A) or dendrite alone (B) are depicted. C–G, Quantification of HA-Nedd4-1 fluorescence local maxima: after various drug treatments described in A (C), time course of AMPA treatments (in minutes) (D), persistence of effect 5 or 10 min after washout of 10 min 10 μm AMPA treatment (indicated by arrowhead) (E), effect of calcium chelation with EGTA (2.5 mm, 15 min pretreatment) (F), and treatments with CNQX (40 μm, 10 min) and ionomycin (10 μm, 15 min) (G); n > 20 dendrites per condition over 3–4 independent experiments. H, Representative immunofluorescent images of dendrites from dissociated hippocampal neurons expressing HA-tagged Nedd4-1 (Sindbis) after AMPA stimulation (10 μm, 10 min) and immunostained with anti-HA (red) and anti-PSD-95 (blue) antibodies. Colocalization of HA and PSD-95 punctate clusters is highlighted by arrowheads. I, Representative immunofluorescent images of dendrites after AMPA stimulation (10 μm, 10 min), immunostained with anti-HA (red) and anti-synapsin I (blue) antibodies. Areas of close HA and synapsin proximity are highlighted by arrowheads. **p < 0.01, ***p < 0.001; ANOVA with Tukey's post hoc analysis. Graphs show mean ± SEM. Scale bar, 10 and 5 μm for whole-cell and dendrite images, respectively.

