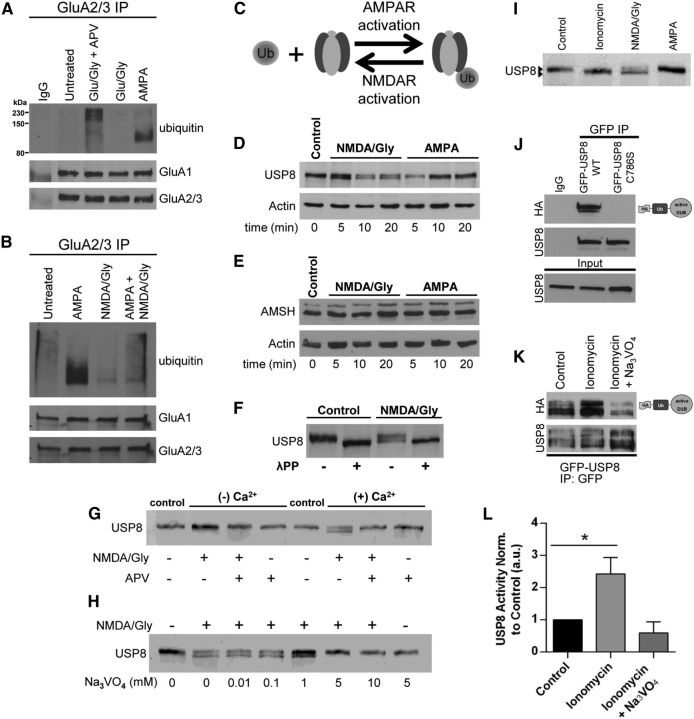
Figure 3.
Rapid NMDAR-dependent dephosphorylation and activation USP8. A, B, Representative Western blots depicting the antagonistic effects of NMDAR activation on the ubiquitination of AMPARs. A, Dissociated cortical neurons (18–21 DIV) were treated for 10 min with AMPA (100 μm), glutamate and glycine (100 μm/10 μm), glutamate and glycine (100 μm/10 μm) with APV (50 μm, 60 min pretreatment), or left untreated before IP with anti-GluA2/3 antibodies in nondenaturing IP conditions. IPs were resolved by SDS-PAGE and Western blot was probed with anti-ubiquitin, anti-GluA1, and anti-GluA2/3 antibodies. B, Coapplication of NMDA/glycine (50 μm/10 μm, 10 min) and AMPA (100 μm, 10 min) indicates that NMDAR activation directly antagonizes AMPA-dependent AMPAR ubiquitination. Shown is a representative blot from 2 or 3 independent experiments. C, Model depicting reversibility of ubiquitination by action of DUBs. D, E, Rapid dephosphorylation of USP8 is induced by NMDA/glycine but not by AMPA (D); there was no detectable modification of AMSH in neurons treated with NMDA/glycine or AMPA (E). Dissociated cortical cultures (DIV > 18) were treated for indicated times (minutes) with either NMDA and glycine (50 μm/10 μm) or AMPA (100 μm). Cell lysates were resolved by SDS-PAGE and probed with anti-USP8, anti-AMSH, or anti-actin (loading control) antibodies. Shown is a representative blot from > 3 independent experiments per condition. F, Lysates resulting from control or NMDA/glycine (50 μm/10 μm, 10 min.) treated dissociated cortical neurons were treated with lambda phosphatase (1 h, 30°C) and exhibit similarly faster migrating band to NMDA/glycine treatments by SDS-PAGE. Shown is a representative blot from 2 independent experiments. G, Dephosphorylation of USP8 induced by NMDA/glycine requires external Ca2+ influx through NMDA receptors. Dissociated cortical neuronal cultures (DIV > 18) were treated for 10 min with either control (untreated) or NMDA/glycine (50 μm/10 μm) plus or minus APV (50 μm, 60 min pretreatment) in HBS or Ca2+-free HBS. Cell lysates were resolved by SDS-PAGE and probed with anti-USP8 antibodies. Shown is a representative blot from 3 independent experiments. H, The general tyrosine phosphatase inhibitor blocks NMDA-dependent dephosphorylation of USP8. Dissociated cortical neuronal cultures (DIV > 18) were treated for 10 min with either control (untreated) or NMDA/glycine (50 μm/10 μm) plus increasing concentrations of sodium orthovanadate (Na3VO4). Cell lysates were resolved by SDS-PAGE and probed with anti-USP8 antibodies. Shown is a representative blot from 3 independent experiments. I, Ionomycin promotes dephosphorylation of USP8 in a similar fashion to NMDAR activation. Dissociated cortical neuronal cultures (DIV > 18) were treated for 10 min with either control (untreated), ionomycin (10 μm), NMDA/glycine (50 μm/10 μm), or AMPA (100 μm). Cell lysates were resolved by SDS-PAGE and probed with anti-USP8 antibodies. Shown is a representative blot from 3 independent experiments. J, Activity assay of USP8. Lysates from HEK293 cells transfected for 18–24 h (PEI) with either WT GFP-tagged USP8 or C746S catalytically inactive mutant were immunoprecipitated with anti-GFP antibodies. Immunoprecipitates were labeled with active DUB labeling reagent HAUb-VME, resolved by SDS-PAGE, and probed with anti-HA and anti-USP8 antibodies. Shown is a representative blot. K, L, Representative blot depicting USP8 activity is enhanced by the Ca2+ ionophore ionomycin. K, HEK293 cells transfected for 18–24 h (PEI) with WT GFP-tagged USP8 were treated for 10 min with ionomycin (10 μm) or left untreated. Lysates were immunoprecipitated with anti-GFP antibodies. Immunoprecipitates were labeled with HAUb-VME, resolved by SDS-PAGE, and probed with anti-HA and anti-USP8 antibodies. L, Graphs showing quantification of USP8 activity (HA signal) normalized to USP8 levels (in IP) relative to control treated cells. *p < 0.05, ANOVA with Dunnett's post hoc analysis; n = 4 independent experiments. Graph shows mean ± SEM.

