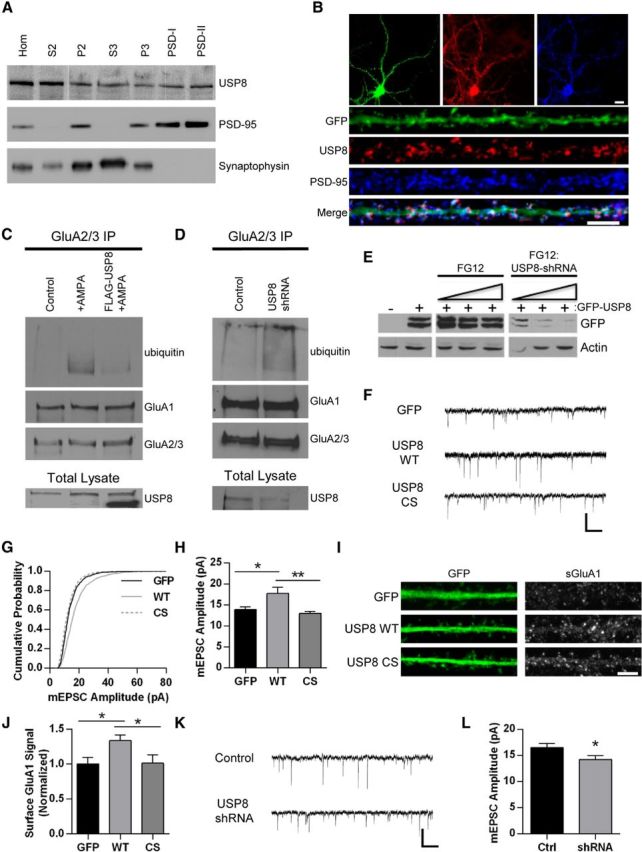
Figure 4.

USP8 regulates synaptic strength. A, Western blot depicting distribution of USP8 across subcellular fractions in rat brain tissue. Brains were homogenized and subjected to biochemical fractionation. Samples of each fraction (homogenate, S2, P2, S3, P3, and postsynaptic density I and II) were resolved by SDS-PAGE and probed for USP8, PSD-95, and synaptophysin. B, Representative immunofluorescent images of dissociated hippocampal neurons 21 DIV expressing GFP (Sindbis, 16–18 h) stained with anti-USP8 (red) and anti-PSD-95 (blue) antibodies. GFP signal in green. Representative maximum z-projected confocal images of whole cell and dendrites are depicted. C, Representative Western blot displaying effect of USP8 overexpression on AMPA-induced AMPAR ubiquitination. Cortical neurons DIV 18–22 were infected with Sindbis USP8-FLAG for 16–18 h or left uninfected and were then treated with AMPA (50 μm, 10 min) or left untreated. Lysates were immunoprecipitated with GluA2/3 antibodies in nondenaturing conditions. IPs were resolved by SDS-PAGE and probed with anti-ubiquitin, anti-GluA1, and anti-GluA2/3 antibodies; total lysates were probed for USP8 (endogenous USP8 running slightly larger by SDS-PAGE). Shown is a representative blot from two independent experiments. D, Representative Western blot depicting increased basal AMPAR ubiquitination with USP8 knockdown. Cortical neurons DIV 14-16 were infected with control FG12 or USP8 shRNA (lentivirus) for 5–6 d before immunoprecipitation with anti-GluA2/3 antibodies. IPs were resolved by SDS-PAGE and probed for ubiquitin, GluA1, and GluA2/3; total lysates were probed for USP8. Shown is a representative blot from two independent experiments. E, Representative Western blot of lysates from HEK293 cells cotransfected with rat GFP-USP8 and FG12 (control vector coexpressing GFP) or shRNA USP8 hairpin (coexpressing GFP). Increasing ratio of FG12 control or shRNA USP8 hairpin (from right to left) is indicated. Actin and GFP blot shown as loading control. F–H, Representative traces of mEPSCs recorded from control GFP-, GFP-USP8 WT-, and GFP-USP8 C746S-expressing hippocampal neurons (18–22 DIV, 18–22 h Sindbis infection) (F); cumulative probability distributions of amplitudes of all mEPSCs recorded from neurons, n = 1206, 1210, 1305 events, respectively (G); mean mEPSC amplitude *p < 0.05, **p < 0.01, ANOVA with Tukey's post hoc analysis; n = 12–13 cells per condition (H). I, Representative images of straightened dendrites from hippocampal neurons 18–22 DIV expressing GFP (control), USP8 WT, or USP8 CS (Sindbis, 18–22 h) and stained for GluA1-containing surface AMPARs (red) and GFP (green). J, Quantification of surface GluA1 signal in all dendrites expressing GFP, USP8 WT, and USP8 CS. *p < 0.05, ANOVA with Tukey's post hoc analysis; n = 36 cells across two independent experiments. K–L, Representative traces of mEPSCs recorded from control FG12- and shRNA USP8 hairpin (coexpressing GFP)-expressing hippocampal neurons (18–22 DIV, lentiviral-based transduction) (K); mean mEPSC amplitude. *p < 0.05, Student's t test; n = 31 cells across four independent experiments (L). Graphs show mean ± SEM. Scale bar, 10 and 5 μm for whole cell and dendrite images, respectively; 500 ms and 20 pA for traces.
