
Figure 4.
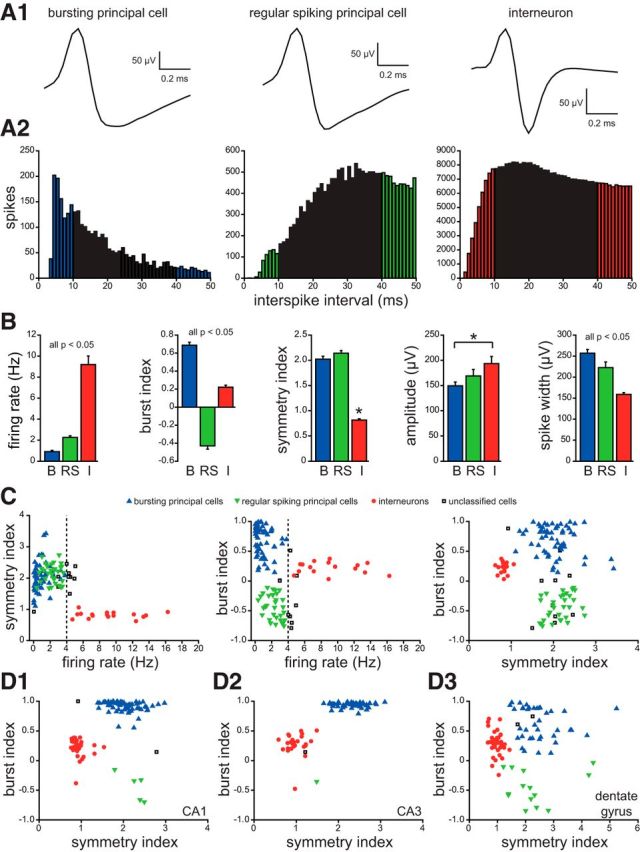
Subicular units classified as bursting principal cells, regular spiking principal cells, or interneurons. A1, Average waveforms of typical examples of each. A2, Autocorrelograms of same cells as in A1. Colored bars indicate parts used to calculate burst index. B, Baseline firing rate, burst index, symmetry index, spike amplitude, and spike width group data from bursting principal cells (B), regular spiking principal cells (RS), and interneurons (I). Burst index is the peak measured from 0 to 10 ms (colored bars in A2) minus mean baseline value measured from 40 to 50 ms (colored bars in A2). The resulting value was normalized to the peak if positive or to the baseline if negative, which yielded burst indices ranging from −1 (tonic firing) to 1 (bursting). Symmetry index is the ratio of waveform peak/valley. Amplitude and spike width were measured from waveform peak to valley. Values indicate mean ± SEM. *p < 0.05, ANOVA with Dunn's test. C, Plots of symmetry index, baseline firing rate, and burst index, which were used for neuron classification. A firing rate of 4 Hz was a defining feature. Units that did not clearly fit into a category were unclassified and omitted from additional analysis. D, Plots of burst index versus symmetry index of cells in CA1 (D1), CA3 (D2), and dentate gyrus (D3).