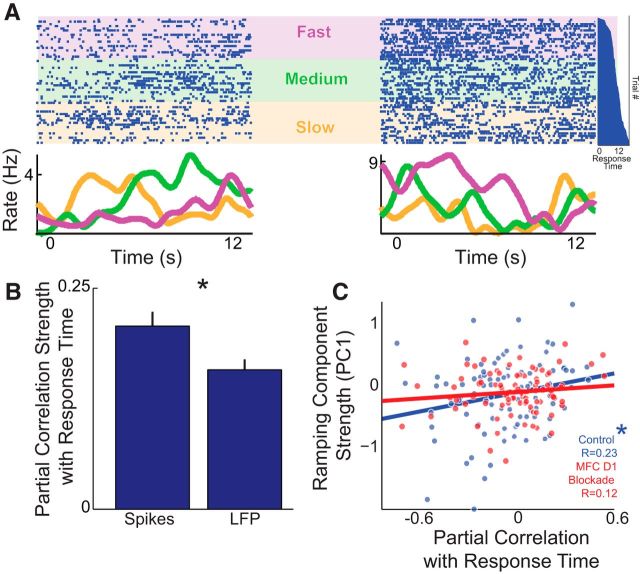
Figure 8.
Ramping neurons can correlate with response times on each trial. A, Two simultaneously recorded ramping MFC neurons from the same animal fired differently on trials with slow, medium, and fast tertiles of average response times. The top portion displays the activity of two single neurons, and each dot represents an action potential; each row is a trial. The bottom line plot displays the average firing rates over time. The vertical histogram (far right in dark blue) shows response times sorted on a trial-by-trial basis; trials on the top have short response times, and trials on the bottom have long response times, aligned with raster. Purple, “fast” third of response times; green, “medium,” or middle third, of response times; orange, “slow” third of response times. Note that subsequent analyses treat the response time as a continuous variable. B, Partial correlation across time with spikes and LFP revealed that spiking activity was more correlated with the response time. Data include all neurons and LFP channels in control sessions; 0–6 s epoch used for correlation to avoid motor confounds. Mean ± SEM plotted; *p < 0.05. C, In control sessions, neurons with strong positive ramping (PC1) were significantly positively correlated with response times (n = 99 neurons) and nonsignificantly correlated in MFC D1DR blockade (n = 91 neurons). *p < 0.05.

