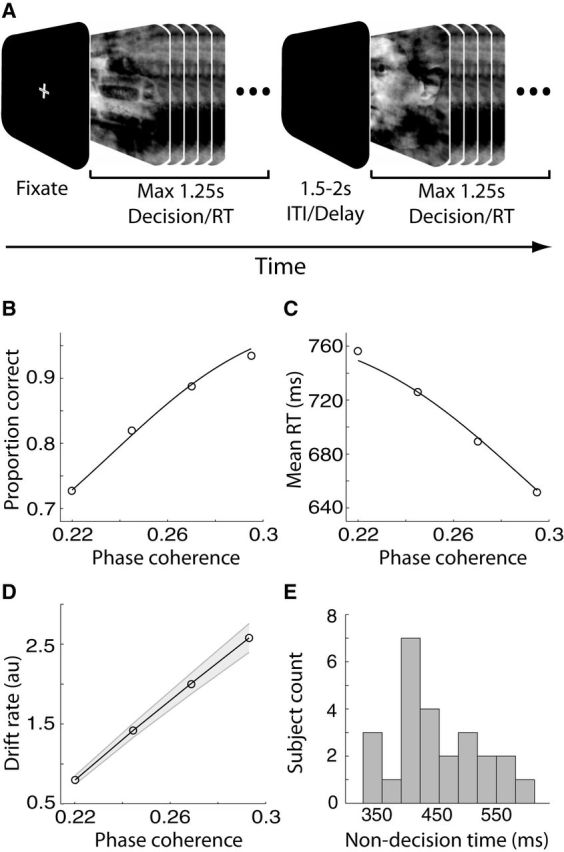
Figure 1.

Experimental design, behavioral, and computational modeling results. A, Schematic representation of our behavioral paradigm. For each trial, a noisy and rapidly updating (every 33.3 ms) dynamic stimulus of either a face or a car image, at one of four possible phase coherence levels, was presented for a maximum of 1.25 s. Within this time subjects had to indicate their choice by pressing a button. The dynamic stimulus was interrupted upon subjects' response and it was followed by a variable delay lasting between 1.5 and 2 s. ITI, Intertrial interval. B, Average proportion of correct choices, across subjects, as a function of the phase coherence of our stimuli. Performance improved as phase coherence increased. C, Average RT, across subjects, as a function of the phase coherence of our stimuli. Mean RT decreased as phase coherence increased. In B and C curves are average model fits to the behavioral data using the diffusion model of Palmer et al. (2005). D, Average DDM drift rates as a function of the phase coherence of our stimuli. Drift rates increased as phase coherence increased. Shaded region represents SEs across subjects. E, DDM non-decision time distribution across participants indicating a sizeable between-subject variability.
