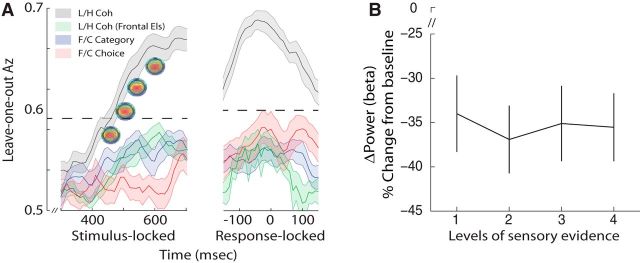
Figure 5.
Control analyses. A, Mean classifier performance (Az) during high-vs-low sensory evidence discrimination along with representative scalp topographies at different time windows during the decision phase (gray), high-vs-low sensory evidence discrimination using only far-frontal sensors (green), face-vs-car category discrimination (blue), and face-vs-car choice discrimination (red) of stimulus- and response-locked data. The dashed line represents the mean Az value leading to a significance level of p = 0.01, estimated using a bootstrap test. Shaded region represents SE across subjects. B, Beta power (18–30 Hz) estimates during a window centered at time of choice, expressed as percentage signal change from prestimulus baseline across the four levels of sensory evidence. Error bars represent SE across subjects.

