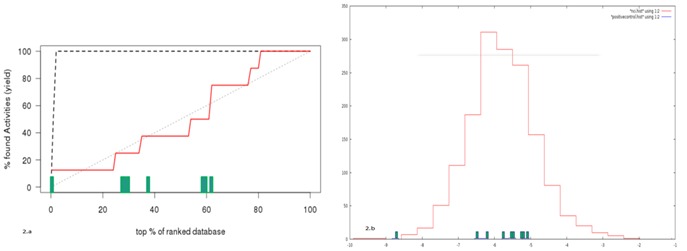
Figure 2.

A) Rank plot of known positives after docking. SID 103691194 is separated adequately from the decoys; B) Prediction of potential inhibitors from libraries: A histogram plot of the docking energies of the NCI diversity set. The energies of known positives are shown as bars on the X-axis.
