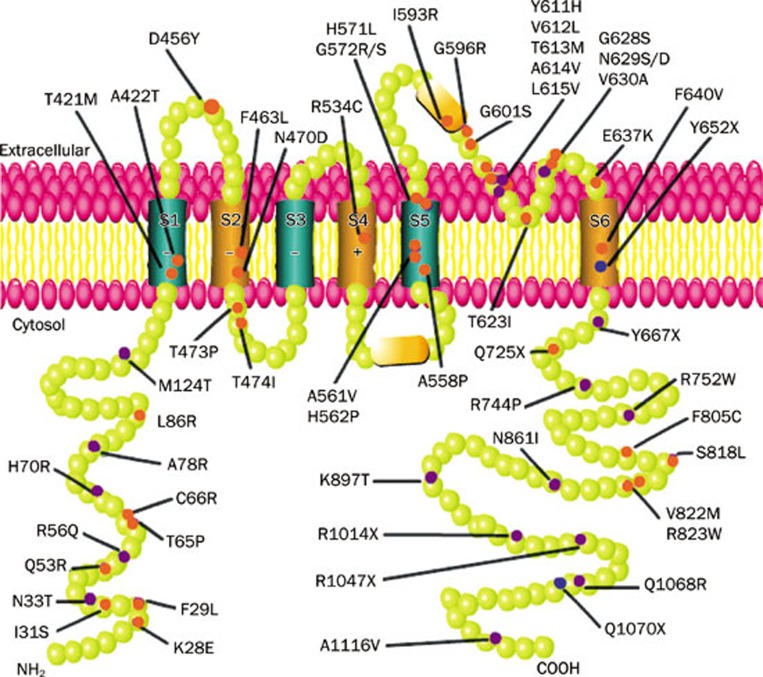
Figure 4.
Schematics of LQT2 mutations. Each green ball represents an amino acid. Each purple, orange and blue point represents one mutation. In addition, the orange points represent mutations showing hERG channel trafficking deficiency and the blue points represent mutations being monitored by the NMD mechanism.

