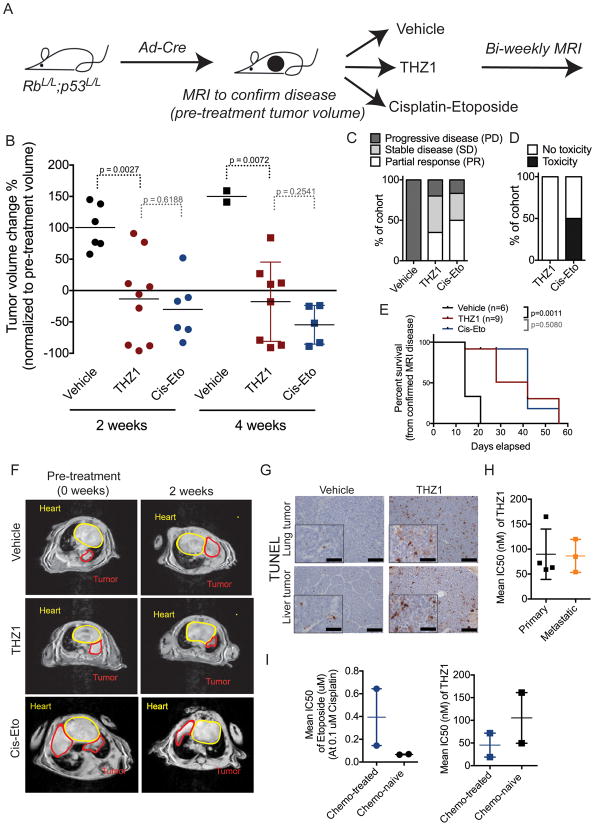
Figure 2. THZ1 treatment of RP mice causes significant tumor response and increased survival.
A) Schematic overview of treatment trial with vehicle (control), THZ1 or Cisplatin-Etoposide compared to vehicle (control) in RP mice with confirmed (by MRI) SCLC disease. THZ1 is dosed at 10 mg/kg BID, Cisplatin-Etoposide (Cis-Eto) is dosed as follow: Cisplatin 5 mg/kg 1x per week, Etoposide 10 mg/kg 3x per week. Cis-Eto is given 1–2 weeks on (pending weight/toxicity) hereafter 2–3 weeks off followed by 1–2 weeks re-treatment (pending weight/toxicity and tumor burden according to MRI). After treatment start MRI was performed biweekly in all treatment cohorts.
B) Tumor volume changes (%) according to MRI quantification in vehicle-treated (control), THZ1-treated and Cisplatin-Etoposide-treated mice at 2 and 4 weeks as normalized to pre-treatment (week 0) tumor volume. p-values between different treatment cohorts were calculated using Students t-test. Data are shown as individual values for tumor volume change (dots or squares) with horizontal line representing mean.
C) Treatment response as divided into PD (progressive disease), SD (stable disease), and PR (partial response) groups in mice treated with vehicle (control), THZ1 or Cis-Eto. Data is shown as percent of total mice in respective treatment cohort.
D) Toxicity events observed in mice treated with THZ1 or Cis-Eto as measured by weight loss in mice. If an animal’s weight decreased to 15 % or below (compared to pre-treatment weight) during the treatment study, animal was recorded to have treatment-induced toxicity. Data is shown as percent (%) of total mice in treatment cohort.
E) Survival of control, THZ1-treated and Cis-Eto-treated mice. p-value was established using log-rank test (Mantel-Cox test).
F) Representative MRIs of thorax region of mice treated with vehicle (control), THZ1 or Cis-Eto at 2 and 4 weeks.
G) Representative 20x field micrographs (inserts 40x field) of Terminal deoxynucleotidyl transferase dUTP nick end-labeling (TUNEL) staining of lung tumor and liver metastases 72 hours after treatment with THZ1 or vehicle. Black scale bar in micrographs (20x) represent 50μm. Black scale bar in insert (40x) represent 25μm.
H) Primary (lung) and metastatic (liver) SCLC lesions were isolated from Ad-Cre induced RP mice for cell line establishment. Cells established from lung tumor (primary) and metastatic (liver tumor) origin were incubated with increasing doses of THZ1, and the IC50s were determined by cell viability assay. IC50 from several different cell lines of either group are plotted to give a total calculated mean IC50 (horizontal line) with error bars representing SEM.
I) SCLC tumor lesions from the lung were isolated from untreated RP mice (n=2) and chemo-treated mice (n=2) for establishment of primary cell lines. Primary cells (at passage 5) were incubated with increasing doses of Cis-Eto (right) or THZ1 (left) and the IC50s were determined by cell viability assay. IC50 from several different cell lines of either group are plotted (squares or dots) to give a total calculated mean IC50 (horizontal line) with error bars representing SEM.
See also Figure S2.

