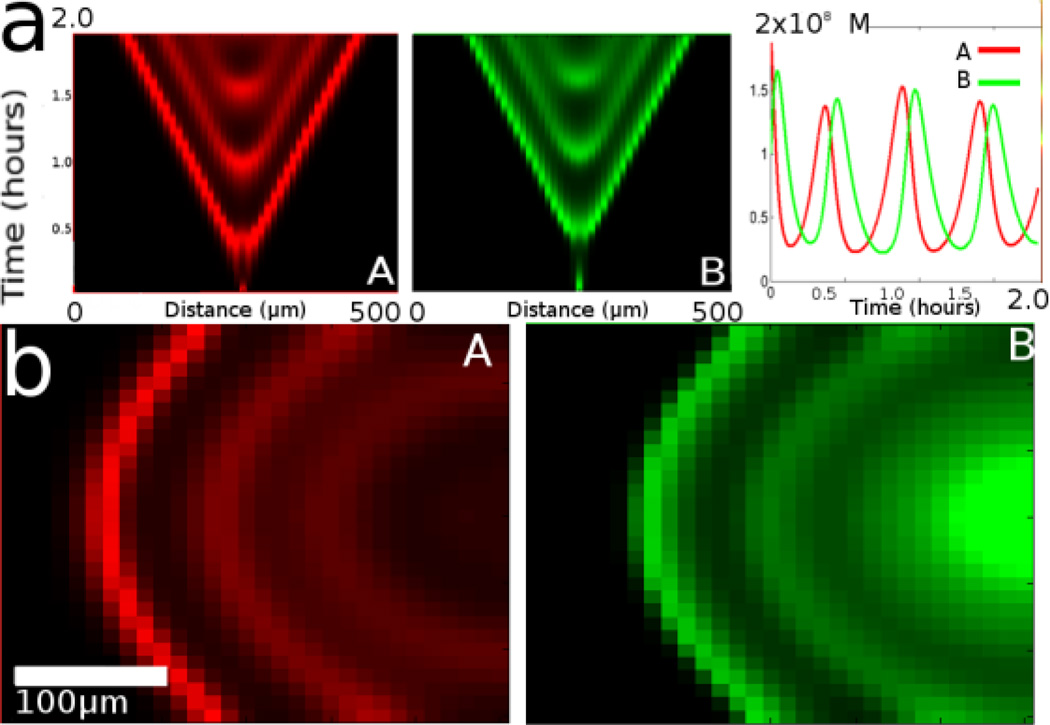
Figure 7.
Periodic patterns created by an amplifier/inhibitor system. (a) Intensity vs location vs. time plot shows the complete 15 species model of the DNA system in time and space with two species X1 and X2 plus their 2-color overlay pattern where X1 is red and X2 is green. (b) A simplified simulation of the system in 2 dimensions at one time point; the waves of production of species X1 and X2 move from right to left in time (see Supporting Material online).

