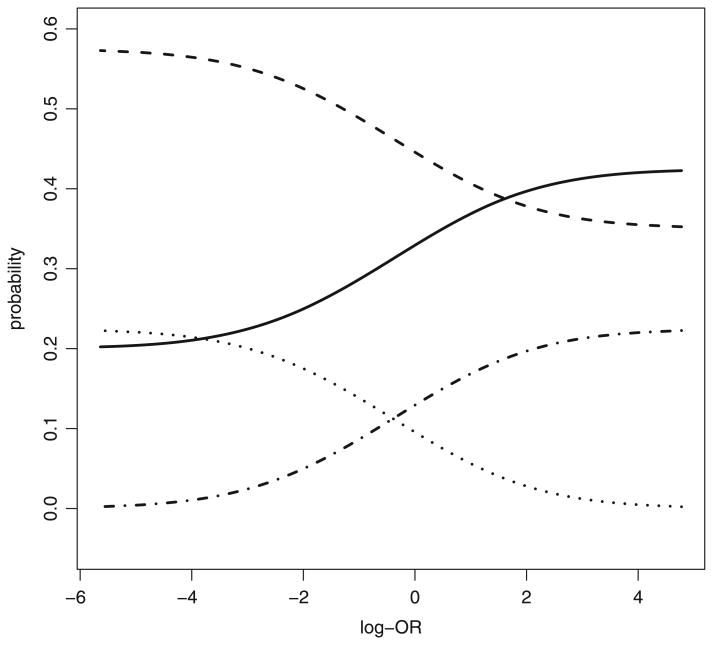
Fig. 1.
Possible values of the cell probabilities in Table 1 as functions of the log-odds ratio, log{π11π00/(π01π10)} for fixed marginal probabilities π1+ = 0.225 and π+1 = 0.575 as estimated from the MOTIVATE study (see Section 4 for details):
 , π00;— — —, π01; · · · · · ·, π10; · — · —, π11

