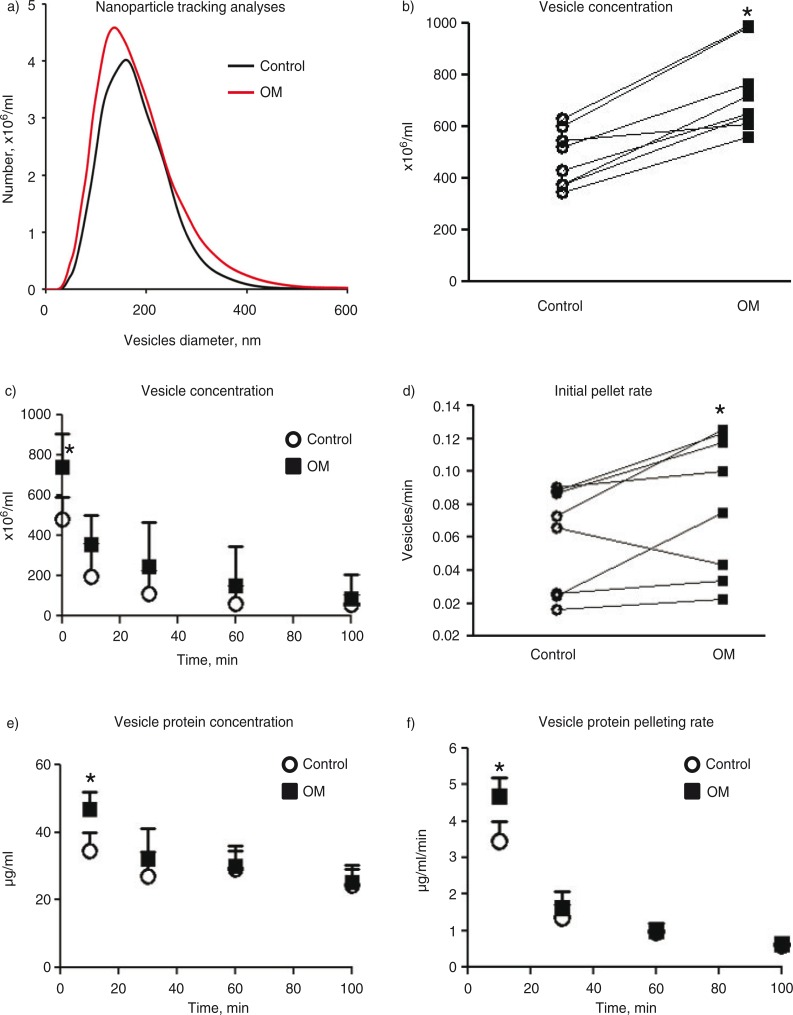
Fig. 2.
Ultracentrifugation of extracellular vesicles. a) NanoSight NTA plot of vesicle diameter versus concentration for control and calcifying samples. b) The concentration of vesicles in the conditioned media of control and calcifying samples as measured by NTA. Connecting lines indicate data obtained from the same experiment. c) The concentration of vesicles remaining in the conditioned media samples over the ultracentrifugation time course. d) The rate at which vesicles are pelleted during the first 10 min of ultracentrifugation. Connecting lines indicate data obtained from the same experiment. e) Protein assay of pelleted vesicles over the ultracentrifugation time course. f) The rate of pelleted protein over the ultracentrifugation time course. *=p<0.05. n=8 independent experiments. Mean±SD

