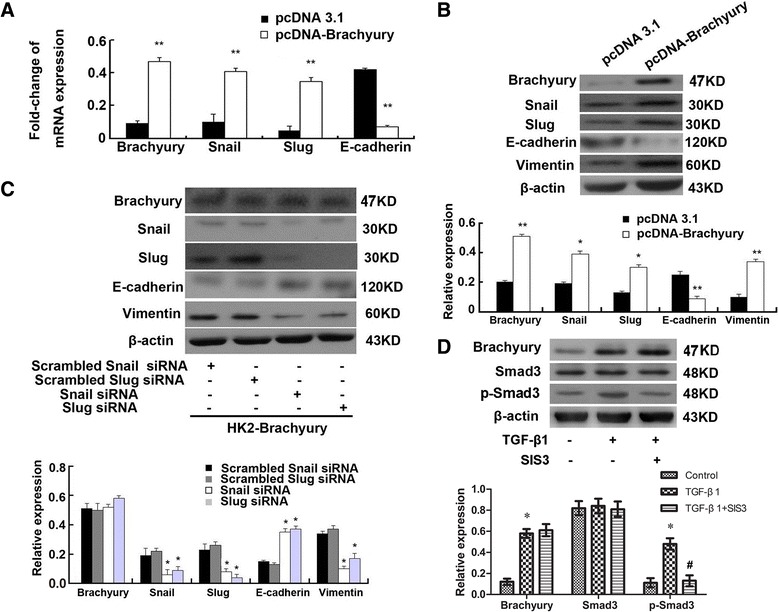
Figure 3.

The effect of Brachyury was mediated by Snail and Slug. (A) qRT-PCR was used for analysis of Brachyury, E-cadherin, Slug and Snail mRNA levels in HK-2-Brachyruy cells. The results shown were representative of three independent experiments. The histogram showed the average volume density corrected for the loading control, GAPDH (n = 3). * P < 0.05 and ** P < 0.01 compared with the pCDNA3.1 empty plasmid transfected cells. (B) Snail, Slug, E-cadherin, vimentin protein level were detected by Western blotting 24 h after transfection with pcDNA3.1-Brachyury or pcDNA3.1 control in HK2 cells. A representative blot from three independent experiments is shown (Top). The histogram shows the average volume density normalized to the β-actin (Bottom) (n = 3). * P < 0.05 and ** P < 0.01 compared with the pCDNA3.1 empty plasmid transfected cells. (C) Expression of Brachyury, Snail, Slug, E-cadherin and vimentin was analyzed by western blotting in Snail-specific siRNA, Slug-specific siRNA or scrambled siRNAs as indicated. A representative blot from three independent experiments is shown (Top). The histogram shows the average volume density normalized to the β-actin (Bottom) (n = 3). * P < 0.05 and ** P < 0.01 compared with the scrambled siRNAs transfected cells. (D) Western blots analysis of Brachyury, Smad3 and p-Smad3 protein levels in HK2 cells pretreated with TGF-β1 or TGF-β1 and SIS3 (Top). The histogram shows the average volume density normalized to the β-actin (Bottom) (n = 3). * P < 0.05 compared with the untreated control cells. # P < 0.05 compared with the TGF-β1 treated cells.
